HOT TOPICS LIST
- MACD
- Fibonacci
- RSI
- Gann
- ADXR
- Stochastics
- Volume
- Triangles
- Futures
- Cycles
- Volatility
- ZIGZAG
- MESA
- Retracement
- Aroon
INDICATORS LIST
LIST OF TOPICS
PRINT THIS ARTICLE
by Koos van der Merwe
A double bottom usually represents a buying opportunity. Are we seeing one now?
Position: Buy
Koos van der Merwe
Has been a technical analyst since 1969, and has worked as a futures and options trader with First Financial Futures in Johannesburg, South Africa.
PRINT THIS ARTICLE
DOUBLE BOTTOMS
A Double Bottom
06/19/14 05:25:36 PMby Koos van der Merwe
A double bottom usually represents a buying opportunity. Are we seeing one now?
Position: Buy
| Keeping an eye on a share price that forms a double bottom is a must. Double bottoms represent a buying opportunity. Most double bottom formations form a 'W' pattern, and a buy signal is usually triggered when the share price rises above the 'middle' of the pattern. Many analysts are inclined to misinterpret a double bottom formation because they look for an inverted head & shoulders (H&S) pattern. The problem with this is that they miss a buying opportunity. Volume in a double bottom formation also tends to increase as the share price starts rising. This is a pattern that should not be discarded. |

|
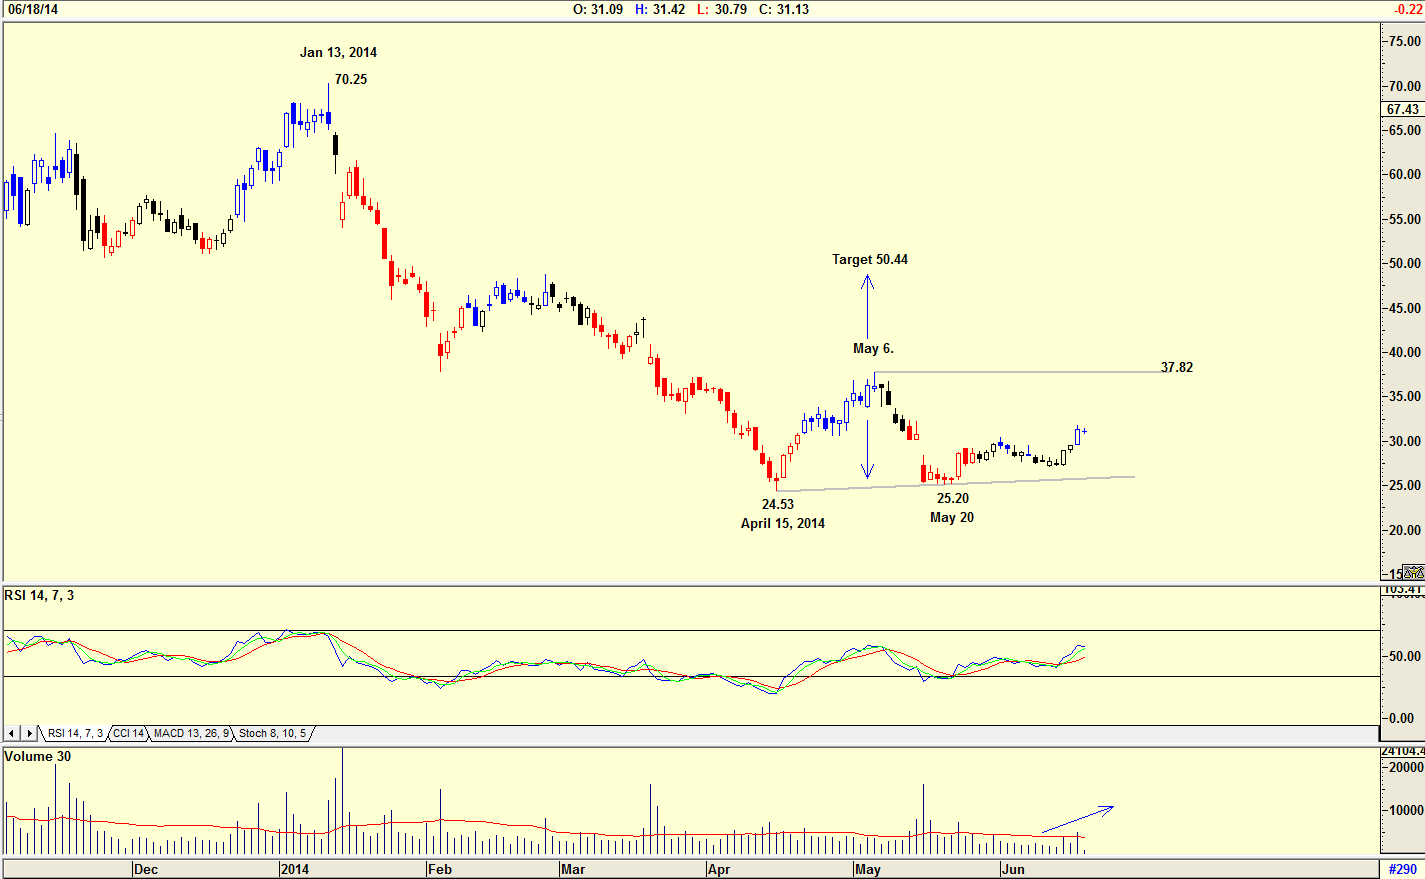
| Figure 1. Daily chart of EXONE showing double bottom formation. |
| Graphic provided by: AdvancedGET. |
| |
| The chart of ExOne (XONE) is suggesting a double bottom formation developing. The chart in Figure 1 is a daily chart showing how the price fell from a high of $70.25 on January 13, 2014 to a low of $24.53 by April 15th, 2014. The price then rose to $37.82 on May 6, 2014 and promptly fell to $24.20 by May 20, 2014 to form a double bottom. Had the share price fallen below $24.53, I would have looked for an inverted H&S pattern rather than a double bottom pattern. With the share price rising as suggested by the relative strength index (RSI), chances are that the price will test the $37.82 level. A move above this resistance level will see the share price rise to the target of $50.44 (37.82-25.20=12.62+37.82=50.44). |

|
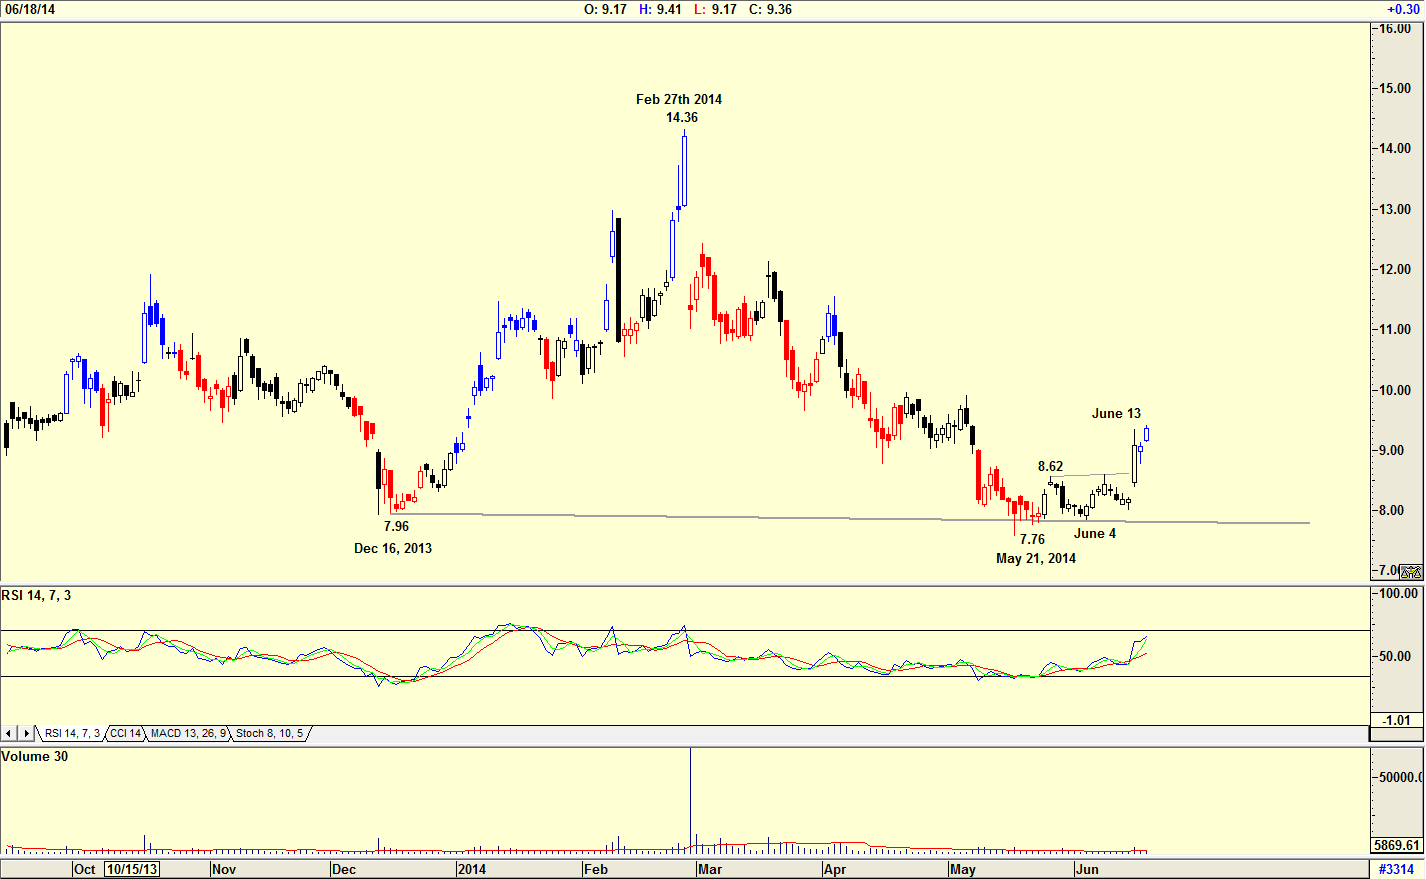
| Figure 2. Daily chart of Compugen showing both double bottom formations. |
| Graphic provided by: AdvancedGET. |
| |
| Of course then there is the false double bottom formation, that is when a double bottom forms over too long a time period as shown in the chart of Compugen Ltd. (CGEN) in Figure 2. The chart shows how the share price hit a low of $7.96 on December 16, 2013, rose to a high of $14.36 by February 27, 2014, and then fell to a low of $7.76 by May 21, 2014 to form a double bottom. Because of the time difference of five months, this is a double bottom pattern that is easy to ignore. However, looking at the chart more closely you can see that a double bottom pattern recently formed. A double bottom formed between May 21, 2014 and June 4, 2014 and a buy signal was triggered when the price broke above $8.62 on June 13, 2014. A double bottom pattern should always trigger a 'watch me' signal. They should never be ignored because they can be profitable. |
Has been a technical analyst since 1969, and has worked as a futures and options trader with First Financial Futures in Johannesburg, South Africa.
| Address: | 3256 West 24th Ave |
| Vancouver, BC | |
| Phone # for sales: | 6042634214 |
| E-mail address: | petroosp@gmail.com |
Click here for more information about our publications!
PRINT THIS ARTICLE

Request Information From Our Sponsors
- StockCharts.com, Inc.
- Candle Patterns
- Candlestick Charting Explained
- Intermarket Technical Analysis
- John Murphy on Chart Analysis
- John Murphy's Chart Pattern Recognition
- John Murphy's Market Message
- MurphyExplainsMarketAnalysis-Intermarket Analysis
- MurphyExplainsMarketAnalysis-Visual Analysis
- StockCharts.com
- Technical Analysis of the Financial Markets
- The Visual Investor
- VectorVest, Inc.
- Executive Premier Workshop
- One-Day Options Course
- OptionsPro
- Retirement Income Workshop
- Sure-Fire Trading Systems (VectorVest, Inc.)
- Trading as a Business Workshop
- VectorVest 7 EOD
- VectorVest 7 RealTime/IntraDay
- VectorVest AutoTester
- VectorVest Educational Services
- VectorVest OnLine
- VectorVest Options Analyzer
- VectorVest ProGraphics v6.0
- VectorVest ProTrader 7
- VectorVest RealTime Derby Tool
- VectorVest Simulator
- VectorVest Variator
- VectorVest Watchdog
