

HOT TOPICS LIST
- MACD
- Fibonacci
- RSI
- Gann
- ADXR
- Stochastics
- Volume
- Triangles
- Futures
- Cycles
- Volatility
- ZIGZAG
- MESA
- Retracement
- Aroon
INDICATORS LIST
LIST OF TOPICS
PRINT THIS ARTICLE
by Donald W. Pendergast, Jr.
Now in a consolidation pattern after a sharp six week rally, shares of Netflix (NFLX) look to be setting up for a bullish continuation move.
Position: N/A
Donald W. Pendergast, Jr.
Freelance financial markets writer and online publisher of the Trendzetterz.com S&P 500 Weekly Forecast service.
PRINT THIS ARTICLE
CONSOLID FORMATION
Netflix: Hourly Consolidation Pattern Before Breakout?
06/18/14 03:56:31 PMby Donald W. Pendergast, Jr.
Now in a consolidation pattern after a sharp six week rally, shares of Netflix (NFLX) look to be setting up for a bullish continuation move.
Position: N/A
| The continued bullish strength in the US stock market during the springtime of 2014 must surely be frustrating to the perma-bears and deflationists among us; however, for those who are content to simply follow emerging trends without letting their personal trading biases get in the way, there has been no shortage of bullish (and bearish) trading opportunities over the past three months. Here's a look at one of the best performers in the US markets of late ‐ Netflix (NFLX). |
|
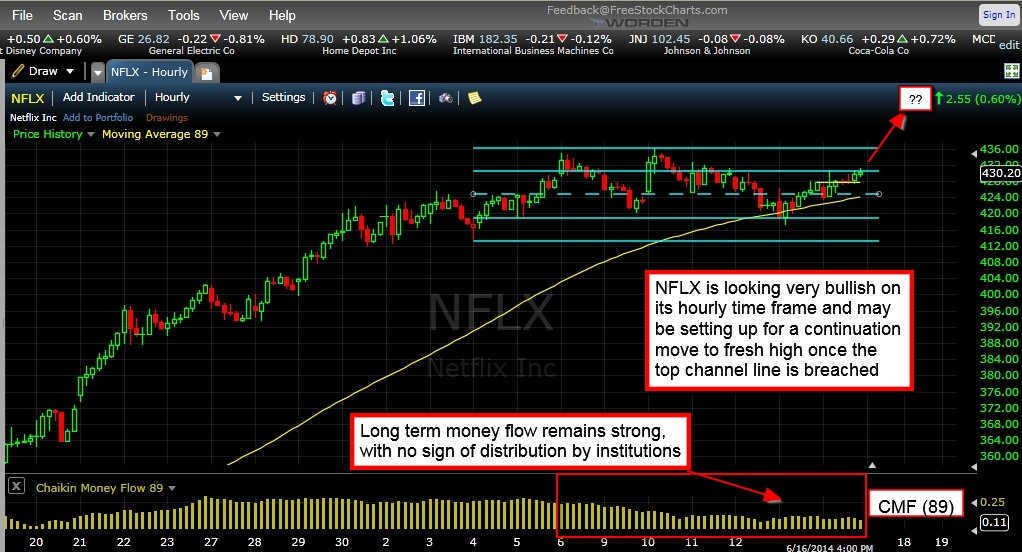
| Figure 1. Hourly Chart Of Netflix (NFLX): After an orderly consolidation and a pullback to its hourly 89-period exponential moving average, NFLX looks set to rock & roll once again. |
| Graphic provided by: FreeStockCharts.com. |
| |
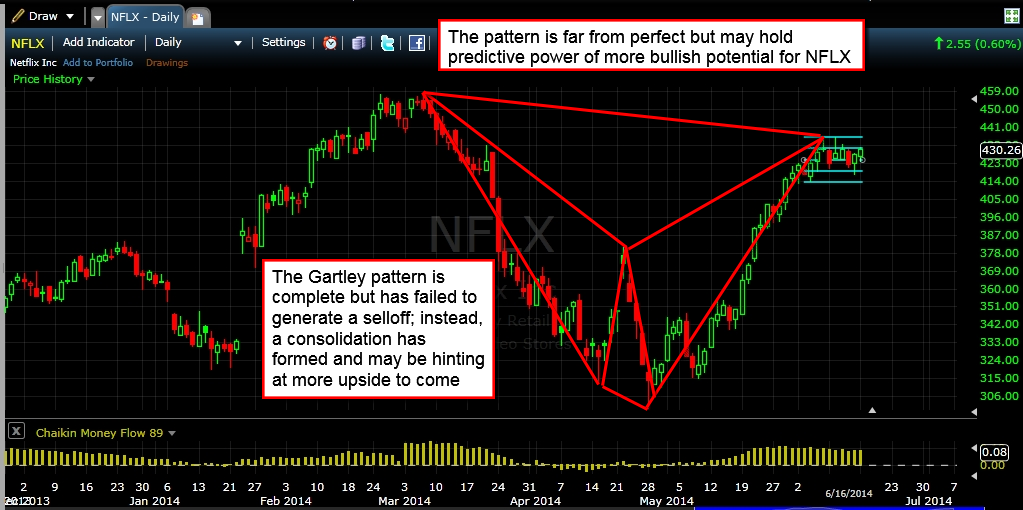
| A dedicated trend trader with even a basic system had loads of opportunity to trade no less than five swing and/or trending moves in NFLX since mid-January 2014: 1. Mid-January to early March 2014 – long 2. Early March 2014 to mid-April 2014 – short 3. Modest swing in mid to late April 2014 – long 4. Modest swing in late April 2014 – short 5. Late May 2014 to early June 2014 – long Not all stocks trend as consistently as NFLX, but a little visual scanning of charts can and will turn up a number of other issues that can also make smooth, tradable moves on a regular basis. And one of the great things about trend following is that when the underlying price cycles in a stock all go into bullish convergence, there can be two or even three powerful trend moves within the larger price cycle's move from trough to peak (and vice versa). That may be what we see shaping up before our eyes in NFLX, looking at its hourly (Figure 1) and daily (Figure 2) charts: A. The bearish Gartley pattern (daily chart) is complete, but has failed to produce an anticipated decline. B. Instead, NFLX is now trading in a range, suggesting more upside once the consolidation completes. C. The hourly chart shows how orderly and non-volatile the stock has been since peaking in early June 2014, and is now back in the upper part of its range. D. Long-term Chaikin Money Flow (CMF)(89) remains stubbornly bullish, holding well above its zero line during the sideways price action. |
|
| Figure 2. NFLX's failed bearish Gartley pattern on the dail chart suggests that a bullish continuation move is now the highest probability play for savvy traders. |
| Graphic provided by: FreeStockCharts.com. |
| |
| Clearly, the highest probability play here is to go long NFLX on a break above the recent high at 436.04, using a simple, near-term covered call setup like this: 1. For every 100 shares of NFLX you own (better have a big account!), sell one front month $430.00 call option against the shares. 2. Use a 13-day exponential moving average (EMA) to trail the combined position; any close below the EMA by NFLX means you close both sides of the trade, immediately. 3. If NFLX continues to trend higher, closing above the EMA, simply hold the position until option expiration. This trade is a continuation move play, so up to 2% of account equity might be risked on this play. Trade wisely until we meet here again. |
Freelance financial markets writer and online publisher of the Trendzetterz.com S&P 500 Weekly Forecast service.
| Title: | Market consultant and writer |
| Company: | Trendzetterz |
| Address: | 81 Hickory Hollow Drive |
| Crossville, TN 38555 | |
| Phone # for sales: | 904-303-4814 |
| Website: | trendzetterz.com |
| E-mail address: | support@trendzetterz.com |
Traders' Resource Links | |
| Trendzetterz has not added any product or service information to TRADERS' RESOURCE. | |
Click here for more information about our publications!
PRINT THIS ARTICLE

Request Information From Our Sponsors
- VectorVest, Inc.
- Executive Premier Workshop
- One-Day Options Course
- OptionsPro
- Retirement Income Workshop
- Sure-Fire Trading Systems (VectorVest, Inc.)
- Trading as a Business Workshop
- VectorVest 7 EOD
- VectorVest 7 RealTime/IntraDay
- VectorVest AutoTester
- VectorVest Educational Services
- VectorVest OnLine
- VectorVest Options Analyzer
- VectorVest ProGraphics v6.0
- VectorVest ProTrader 7
- VectorVest RealTime Derby Tool
- VectorVest Simulator
- VectorVest Variator
- VectorVest Watchdog
- StockCharts.com, Inc.
- Candle Patterns
- Candlestick Charting Explained
- Intermarket Technical Analysis
- John Murphy on Chart Analysis
- John Murphy's Chart Pattern Recognition
- John Murphy's Market Message
- MurphyExplainsMarketAnalysis-Intermarket Analysis
- MurphyExplainsMarketAnalysis-Visual Analysis
- StockCharts.com
- Technical Analysis of the Financial Markets
- The Visual Investor