

HOT TOPICS LIST
- MACD
- Fibonacci
- RSI
- Gann
- ADXR
- Stochastics
- Volume
- Triangles
- Futures
- Cycles
- Volatility
- ZIGZAG
- MESA
- Retracement
- Aroon
INDICATORS LIST
LIST OF TOPICS
PRINT THIS ARTICLE
by Billy Williams
Core Laboratories (CLB) seems to have self-destructed and busted its bullish trend but it may be signaling to go long once again.
Position: Buy
Billy Williams
Billy Williams has been trading the markets for 27 years, specializing in momentum trading with stocks and options.
PRINT THIS ARTICLE
PIVOT POINT
Core Laboratories' Pending Long Signal
06/17/14 05:05:51 PMby Billy Williams
Core Laboratories (CLB) seems to have self-destructed and busted its bullish trend but it may be signaling to go long once again.
Position: Buy
| Once a high-flying stock, Core Laboratories seems to have fallen on hard times as investor sentiment has soured on the company causing many traders to flee from the stock. With operations spread out across the globe and heavily involved in the extraction of oil and energy, CLB has been a major player on the global stage with contracts among the "Who's Who" in big oil companies such as Shell, the Saudi government, and other oil conglomerates. The stock has been trading higher thanks to a solid bullish trend for most of the year but has stumbled recently. As a result, the bullish trend that was once in place is now busted and doubts hang in the air as to whether it can recover. However, those doubts may be signaling that now is the time to look at getting in CLB before others wake up to the stock's recovery. |
|
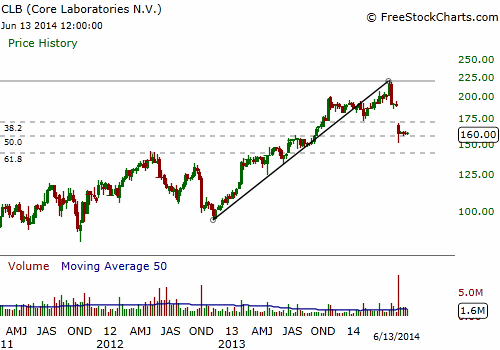
| Figure 1. CLB's weekly chart shows the bullish trend that was in force until a huge price gap derailed its price direction. Price is at the .50 Fib level and showing support at the moment. |
| Graphic provided by: www.freestockcharts.com. |
| |
| CLB bottomed in early November of 2012 and has been steadily trading higher since that time (Figure 1). From a low of $94.72, the stock climbed to an impressive $221 a share. This represented a gain of almost 128 points for a 135% return in just 18 months. Unfortunately, this momentum came to a screeching halt in late April 2014. CLB suffered a huge price gap as the stock's price action opened up 14 points lower on April 24, 2014 on volume almost 500% of its 20-day average (Figure 2). At the time, the disparity between the previous trading day and the day of the price gap was severe but traders were hopeful that it was just investor overreaction and that the stock could recover. This was "trading on hope" as the smart money observed the price/volume and knew that it was time to get out. |
|
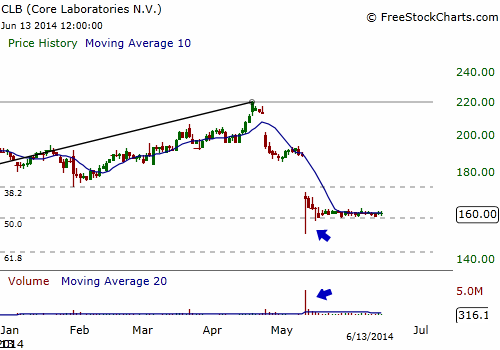
| Figure 2. The second price gap was marked with huge volume which may indicate an exhaustion gap. All the bears may have made a last ditch effort to force the stock lower but, for now, it is showing strength at the .50 Fib level. If the stock begins to trade higher from this level, then CLB has a good chance of recovering to its old price high of $221. |
| Graphic provided by: www.freestockcharts.com. |
| |
| This started a chain reaction, igniting investors' fears and caused shareholders to run from CLB, pushing the stock's price down further. On May 12, 2014, CLB suffered another price gap of over 22 points. Volume swelled to just over 840% of its 20-day average and the stock was sent into a freefall. CLB looks to be in serious trouble and the bears are preparing for shorts, but the stock's price action seems to be showing some strength. Though the stock has traded below the .382 Fib level, it seems to have found some support on the .50 Fib level. Retracements to either the .382 or .50 Fib levels show some level of strength and the potential to trade back to the previous highs and/or possibly trade beyond them. CLB's previous high is $221 so if the stock has a chance of trading back to this level then traders need to see more volume enter this stock on the side of the bulls. |
| With a price gap lying just overhead from where the stock is trading now, and if bullish volume enters into CLB, then there is a good chance that CLB will close this gap. Right now, price is hugging the .50 Fib level pretty closely and seems to be finding support, which it will need as a jump-point to trade higher. Look for volume greater than the previous 10 trading days to occur just as the price bar closes higher and over the 10-day simple moving average at the same time. This is a bullish entry signal that reveals the starting point for recovery in a stock during a pullback or in a price correction. If you're a little hesitant to enter at this level, then wait for CLB to make a higher high in its price action followed by a higher low and then enter as the stock trades past the previous higher high. This price pattern confirms that a market reversal is in effect and is a bit more conservative though not as profitable as the signal detailed previously. |
Billy Williams has been trading the markets for 27 years, specializing in momentum trading with stocks and options.
| Company: | StockOptionSystem.com |
| E-mail address: | stockoptionsystem.com@gmail.com |
Traders' Resource Links | |
| StockOptionSystem.com has not added any product or service information to TRADERS' RESOURCE. | |
Click here for more information about our publications!
PRINT THIS ARTICLE

Request Information From Our Sponsors
- StockCharts.com, Inc.
- Candle Patterns
- Candlestick Charting Explained
- Intermarket Technical Analysis
- John Murphy on Chart Analysis
- John Murphy's Chart Pattern Recognition
- John Murphy's Market Message
- MurphyExplainsMarketAnalysis-Intermarket Analysis
- MurphyExplainsMarketAnalysis-Visual Analysis
- StockCharts.com
- Technical Analysis of the Financial Markets
- The Visual Investor
- VectorVest, Inc.
- Executive Premier Workshop
- One-Day Options Course
- OptionsPro
- Retirement Income Workshop
- Sure-Fire Trading Systems (VectorVest, Inc.)
- Trading as a Business Workshop
- VectorVest 7 EOD
- VectorVest 7 RealTime/IntraDay
- VectorVest AutoTester
- VectorVest Educational Services
- VectorVest OnLine
- VectorVest Options Analyzer
- VectorVest ProGraphics v6.0
- VectorVest ProTrader 7
- VectorVest RealTime Derby Tool
- VectorVest Simulator
- VectorVest Variator
- VectorVest Watchdog