HOT TOPICS LIST
- MACD
- Fibonacci
- RSI
- Gann
- ADXR
- Stochastics
- Volume
- Triangles
- Futures
- Cycles
- Volatility
- ZIGZAG
- MESA
- Retracement
- Aroon
INDICATORS LIST
LIST OF TOPICS
PRINT THIS ARTICLE
by Koos van der Merwe
Cleaning up a mess. Hats off to the CEO, Mary Barra. Are women CEOs teaching us something?
Position: Accumulate
Koos van der Merwe
Has been a technical analyst since 1969, and has worked as a futures and options trader with First Financial Futures in Johannesburg, South Africa.
PRINT THIS ARTICLE
HEAD & SHOULDERS
GM: Time To Buy?
06/17/14 04:54:59 PMby Koos van der Merwe
Cleaning up a mess. Hats off to the CEO, Mary Barra. Are women CEOs teaching us something?
Position: Accumulate
| We all know that General Motors emerged from a government -backed Chapter 11 reorganization, shedding several well-known brands in the process. In 2010 they made an initial public offering and returned to profitability once more. However, the company is presently undergoing an investigation by Congress as to why it took ten years to fix an ignition defect linked to at least 13 known deaths. Mary Barra has fired 15 workers after investigation into the deadly ignition defect revealed neglect. The company has reported annual profits since 2010. It is allowed to carry forward previous losses to reduce tax liability on future earnings. There is no doubt that Mary Barra is working to clean up the mess that was, and in some instances, still is. On June 13, 2014 the company recalled half a million Camaros over a power loss. To-date recalls are close to 14 million vehicles. With the company showing it cares about its image, is it time to buy the share and hold for the long term? |

|
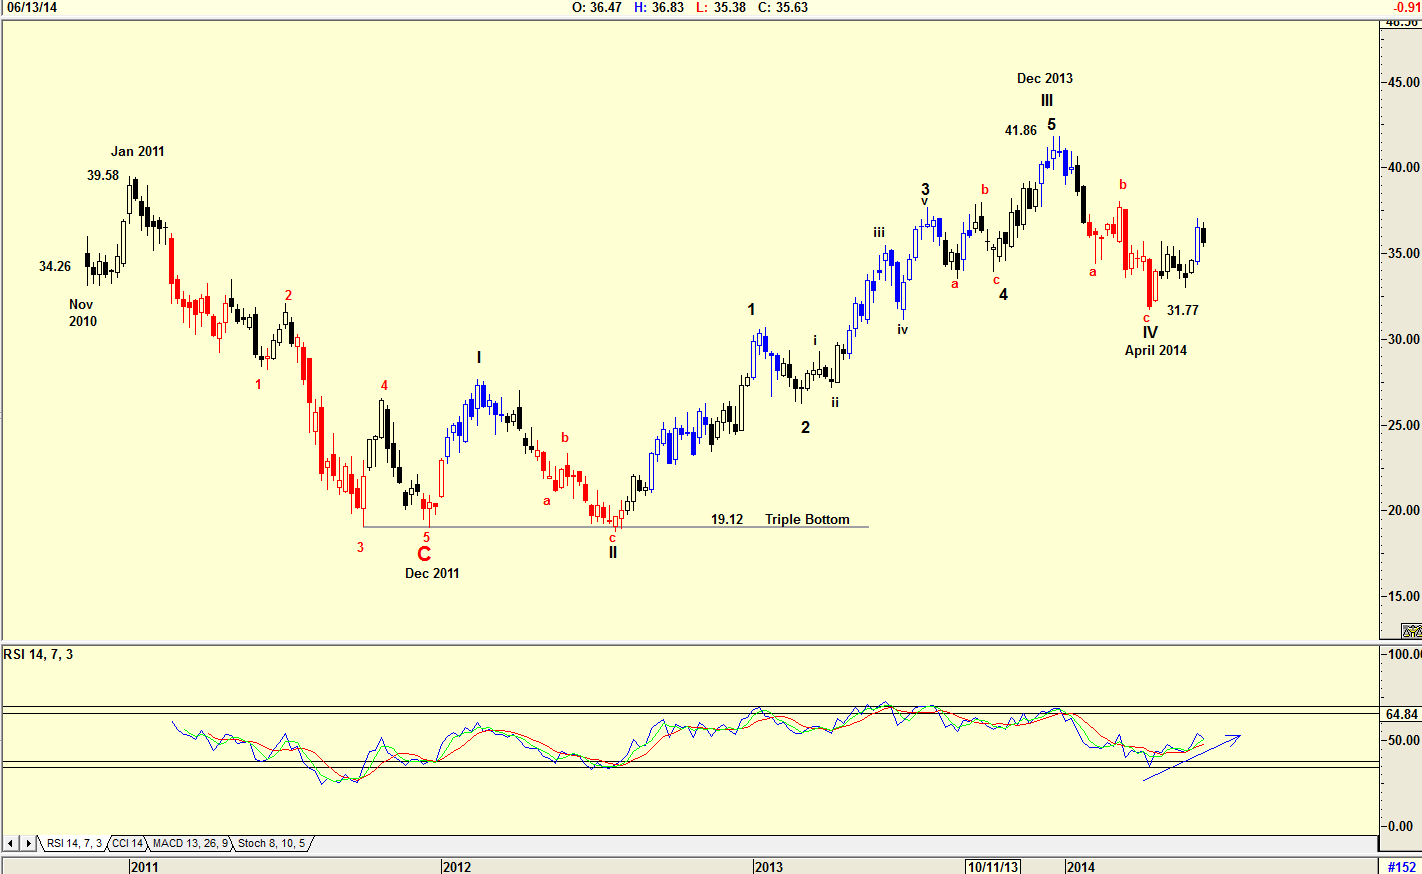
| Figure 1. Weekly chart of General Motors with Elliott Wave count. |
| Graphic provided by: AdvancedGET. |
| |
| The chart in Figure 1 is a weekly chart showing how the share moved since it was relisted in November 2010 closing at $34.26. The share price rose to a high of $39.58 by January 2011, but then fell to form a triple bottom at $19.12. The price then rose to $41.86 by December 2013, but has since fallen to form a low of $31.77 by April 2014. The Elliott Wave count is suggesting that this low is a WAVE IV correction and that the share price is now rising in a WAVE V. The RSI indicator is rising, suggesting strength. |

|
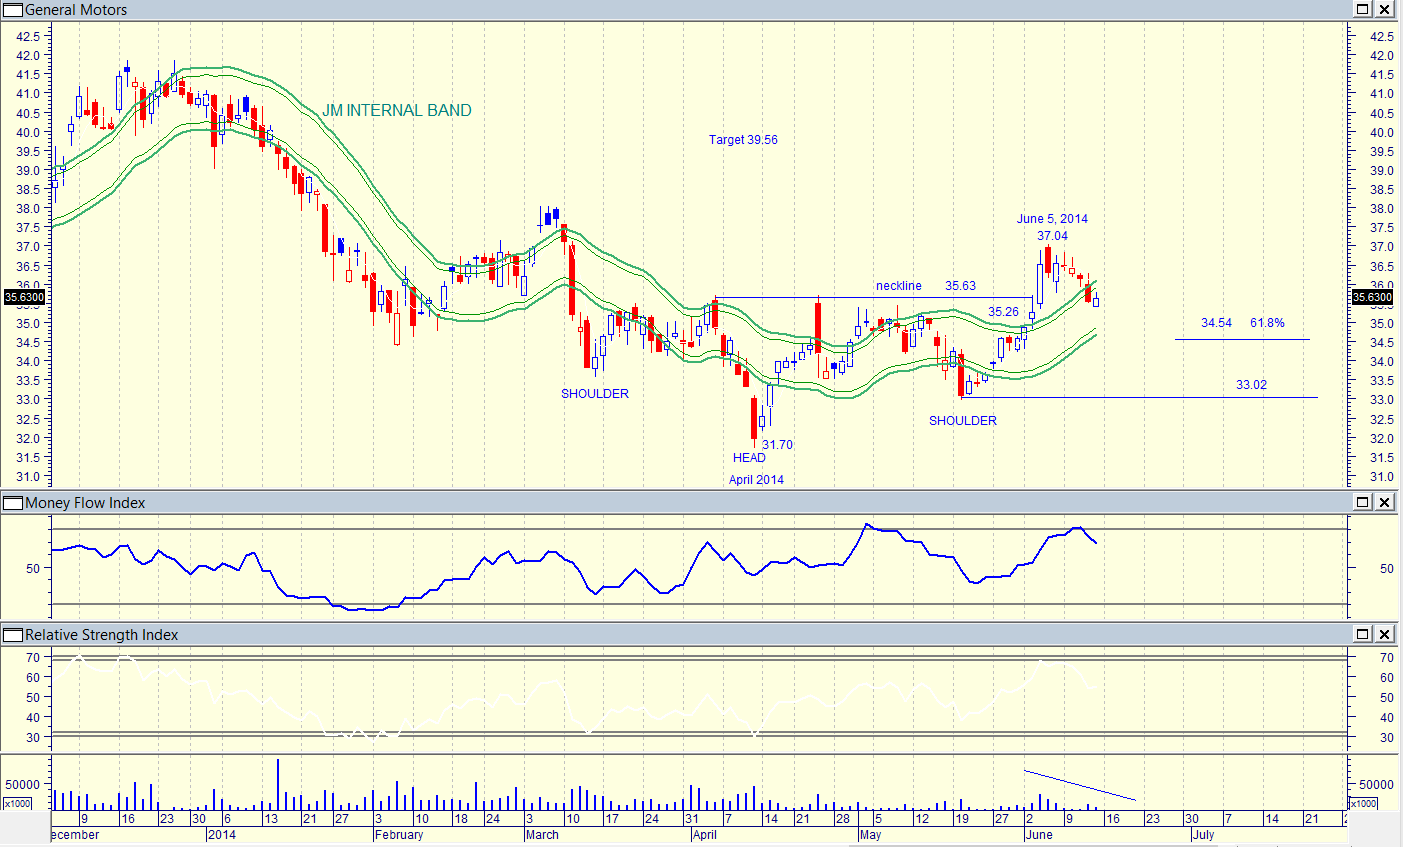
| Figure 2. Daily chart showing inverted head & shoulder formation with target. |
| Graphic provided by: MetaStock. |
| |
| The chart in Figure 2 is a daily chart showing the inverted head & shoulder formation that developed. The target is $39.56 (35.63-31.70=3.93+35.63=39.56). The money flow index and the relative strength index (RSI) are suggesting overbought, and that a correction is in the cards. Volume on the correction, however, is low, but then looking at the chart you can see that since April 2014 when the inverted head formed, volume has been low, probably caused by caution among traders and investors as the ignition defect was revealed. Note the buy signal given by the JM Internal Band indicator when the price rose above $35.26. The JM Internal Band indicator is a 15-period simple moving average offset by 2% positive and 2% negative. A move above the upper band suggests a buy signal, and below the lower band a sell signal. The chart also suggests that the correction could fall to $34.54, the 61.8% Fibonacci correction from $33.02 to $37.04. We have seen how Marissa Mayer is succeeding with Yahoo; how Meg Whitman is reviving Hewlett-Packard; and now how Mary Barra is cleaning up General Motors. Is there a message here? |
Has been a technical analyst since 1969, and has worked as a futures and options trader with First Financial Futures in Johannesburg, South Africa.
| Address: | 3256 West 24th Ave |
| Vancouver, BC | |
| Phone # for sales: | 6042634214 |
| E-mail address: | petroosp@gmail.com |
Click here for more information about our publications!
PRINT THIS ARTICLE

|

Request Information From Our Sponsors
- StockCharts.com, Inc.
- Candle Patterns
- Candlestick Charting Explained
- Intermarket Technical Analysis
- John Murphy on Chart Analysis
- John Murphy's Chart Pattern Recognition
- John Murphy's Market Message
- MurphyExplainsMarketAnalysis-Intermarket Analysis
- MurphyExplainsMarketAnalysis-Visual Analysis
- StockCharts.com
- Technical Analysis of the Financial Markets
- The Visual Investor
- VectorVest, Inc.
- Executive Premier Workshop
- One-Day Options Course
- OptionsPro
- Retirement Income Workshop
- Sure-Fire Trading Systems (VectorVest, Inc.)
- Trading as a Business Workshop
- VectorVest 7 EOD
- VectorVest 7 RealTime/IntraDay
- VectorVest AutoTester
- VectorVest Educational Services
- VectorVest OnLine
- VectorVest Options Analyzer
- VectorVest ProGraphics v6.0
- VectorVest ProTrader 7
- VectorVest RealTime Derby Tool
- VectorVest Simulator
- VectorVest Variator
- VectorVest Watchdog
