

HOT TOPICS LIST
- MACD
- Fibonacci
- RSI
- Gann
- ADXR
- Stochastics
- Volume
- Triangles
- Futures
- Cycles
- Volatility
- ZIGZAG
- MESA
- Retracement
- Aroon
INDICATORS LIST
LIST OF TOPICS
PRINT THIS ARTICLE
by Donald W. Pendergast, Jr.
Up by 130% since April 2013, shares of Avgo Technologies appear to be setting up for a correction of some degree.
Position: N/A
Donald W. Pendergast, Jr.
Freelance financial markets writer and online publisher of the Trendzetterz.com S&P 500 Weekly Forecast service.
PRINT THIS ARTICLE
CHART ANALYSIS
AVGO: Smart Money Moving On?
06/16/14 04:00:35 PMby Donald W. Pendergast, Jr.
Up by 130% since April 2013, shares of Avgo Technologies appear to be setting up for a correction of some degree.
Position: N/A
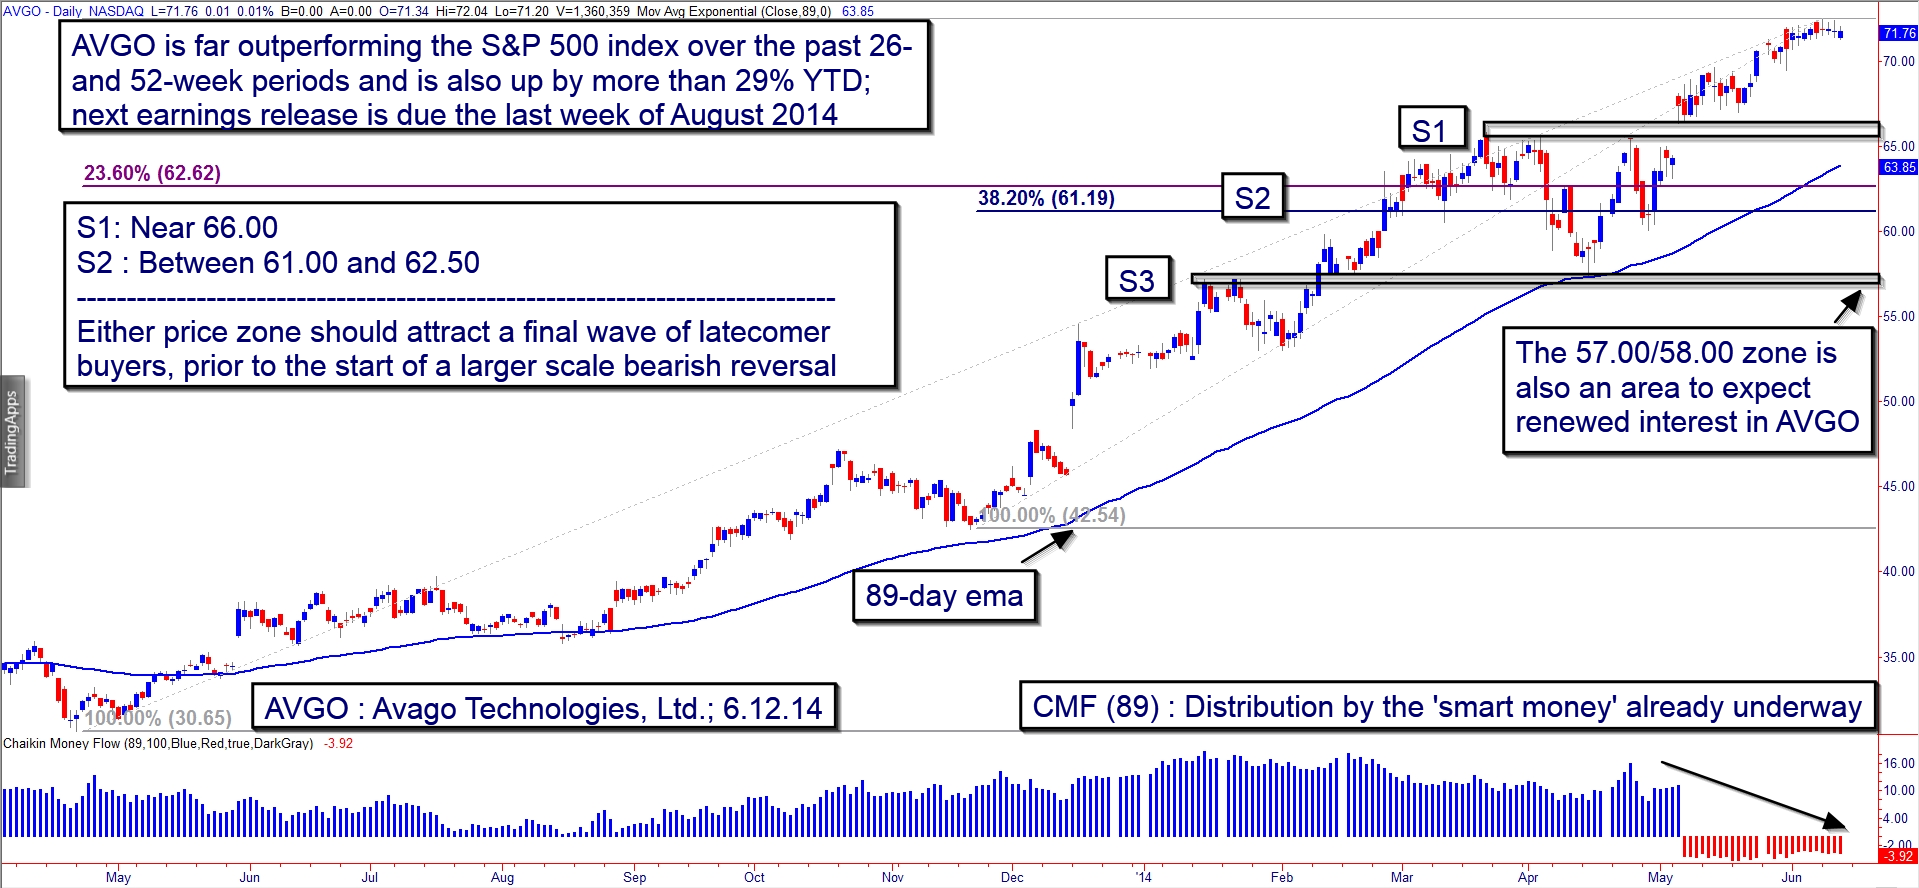
| Nothing exceeds like excess, as the old saying goes, and in the case of stocks that the big institutions have targeted for a major buying campaign, the gains that can be realized by such issues can indeed seem to be excessive as the price gets pushed to one new high after another. Once a large cap starts trending higher — especially if it has a history of earnings growth — you have a powerful set of edges working in your favor, especially if you follow that trend. And once that trend matures, you can also watch these same 'smart money' interests tip their hand by way of long-term money flow analysis; this often reliably predicts an upcoming trend reversal and can help savvy traders book profits earlier rather than later. Let's look at what the smart money is already up to in AVGO, using its daily chart (Figure 1). |
|
| Figure 1. Avgo Technologies Ltd. (AVGO): The open gap at S1 and the Fibonacci 24/38% lines at S2 are high probability support zones; note the rapid deterioration in the money flow histogram during the latest rally. |
| Graphic provided by: TradeStation. |
| |
| AVGO has spent most of its time since late April 2013 trading above its 89-day exponential moving average (EMA), which is still sloping upward; this is a sign of a healthy intermediate to long-term bull market, as is the series of higher swing highs/higher swing lows that the stock keeps making. However, there is trouble brewing here for AVGO bulls, and it looks like this: The 89-day Chaikin Money flow (CMF)(89) histogram has gone negative — in a big way — during the sharp rally phase seen in May/June '14 and is a clear warning that the 'smart money' is using the rally to unload their holdings of AVGO into the hands of latecomers hoping for ever higher prices. This pattern of distribution where stock is exchanged from 'strong hands' to 'weak hands' is normally a standard feature of major tops and bearish trend reversals after a sustained rally, and it appears in virtually all liquid stocks, across different time frames (but is more reliable on daily and weekly charts). This is not a 'short' signal per se, but a clear signal that current longs in the stock need to be taking precautions to protect their open gains with trailing stops, protective puts, or outright profit-taking. |
|
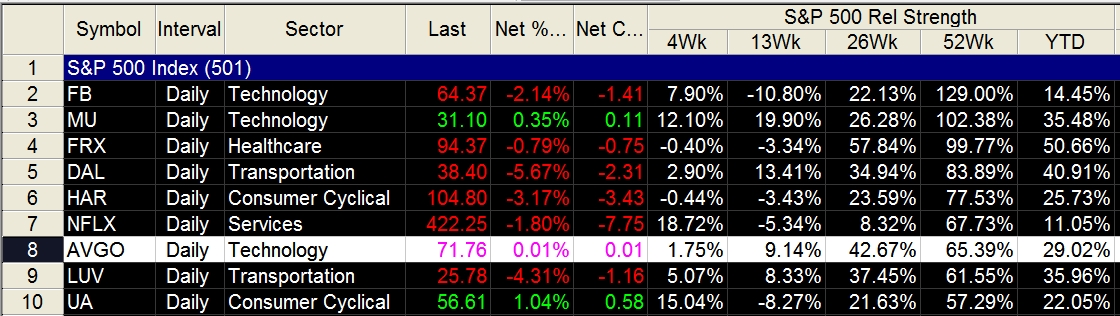
| Figure 2. AVGO is outperforming the .SPX over the past 4-, 13-, 26- and 52-week periods and is also up by 29% YTD. |
| Graphic provided by: TradeStation. |
| Graphic provided by: TradeStation RadarScreen. |
| |
| The bears can always take a shot on the short side with AVGO here, but only if they: 1. Are trading on a 30 to 60-minute chart. 2. Are fully aware of the support levels marked on the daily chart — S1, S2, and S3. 3. Are very skilled and nimble with their entries/exits. The reason for this caution on the short side, is of course that the stock is still technically in a daily/weekly uptrend and that there will be a crowd of latecomers almost certain to jump in on the long side once S1 or S2 is reached. Once AVGO drops beneath its 89-day EMA, the chances for success with short trades will become more favorable, but until that happens most traders will want to only trade the long side from key support levels in this stock. And if you're long any large caps that are manifesting similar distribution patterns, by all means take some basic steps to either protect, lock in, or take some of your profits now. Trade wisely until we meet here again. |
Freelance financial markets writer and online publisher of the Trendzetterz.com S&P 500 Weekly Forecast service.
| Title: | Market consultant and writer |
| Company: | Trendzetterz |
| Address: | 81 Hickory Hollow Drive |
| Crossville, TN 38555 | |
| Phone # for sales: | 904-303-4814 |
| Website: | trendzetterz.com |
| E-mail address: | support@trendzetterz.com |
Traders' Resource Links | |
| Trendzetterz has not added any product or service information to TRADERS' RESOURCE. | |
Click here for more information about our publications!
PRINT THIS ARTICLE

Request Information From Our Sponsors
- VectorVest, Inc.
- Executive Premier Workshop
- One-Day Options Course
- OptionsPro
- Retirement Income Workshop
- Sure-Fire Trading Systems (VectorVest, Inc.)
- Trading as a Business Workshop
- VectorVest 7 EOD
- VectorVest 7 RealTime/IntraDay
- VectorVest AutoTester
- VectorVest Educational Services
- VectorVest OnLine
- VectorVest Options Analyzer
- VectorVest ProGraphics v6.0
- VectorVest ProTrader 7
- VectorVest RealTime Derby Tool
- VectorVest Simulator
- VectorVest Variator
- VectorVest Watchdog
- StockCharts.com, Inc.
- Candle Patterns
- Candlestick Charting Explained
- Intermarket Technical Analysis
- John Murphy on Chart Analysis
- John Murphy's Chart Pattern Recognition
- John Murphy's Market Message
- MurphyExplainsMarketAnalysis-Intermarket Analysis
- MurphyExplainsMarketAnalysis-Visual Analysis
- StockCharts.com
- Technical Analysis of the Financial Markets
- The Visual Investor