

HOT TOPICS LIST
- MACD
- Fibonacci
- RSI
- Gann
- ADXR
- Stochastics
- Volume
- Triangles
- Futures
- Cycles
- Volatility
- ZIGZAG
- MESA
- Retracement
- Aroon
INDICATORS LIST
LIST OF TOPICS
PRINT THIS ARTICLE
by Matt Blackman
Since its launch in 2013, Twitter (TWTR) has had its ups and downs. But could the worst now be over for this newest Internet poster child?
Position: N/A
Matt Blackman
Matt Blackman is a full-time technical and financial writer and trader. He produces corporate and financial newsletters, and assists clients in getting published in the mainstream media. He is the host of TradeSystemGuru.com. Matt has earned the Chartered Market Technician (CMT) designation. Find out what stocks and futures Matt is watching on Twitter at www.twitter.com/RatioTrade
PRINT THIS ARTICLE
DOUBLE BOTTOMS
Twitter - On The Comeback Trail But For How Long?
06/16/14 03:54:26 PMby Matt Blackman
Since its launch in 2013, Twitter (TWTR) has had its ups and downs. But could the worst now be over for this newest Internet poster child?
Position: N/A
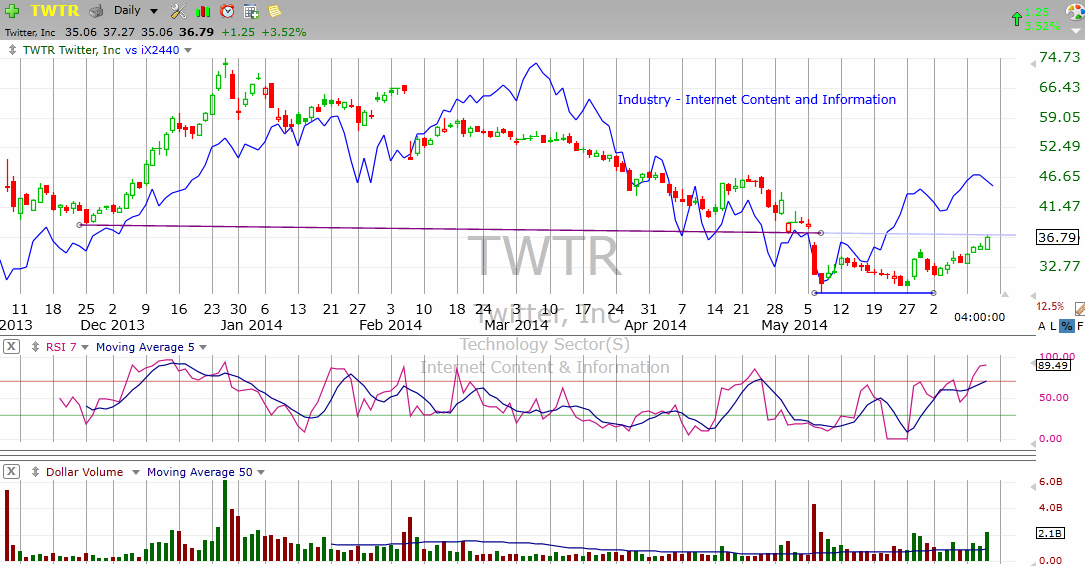
| On November 7, 2013, the first day Twitter shares began trading, the stock soared to a high of more than $50, nearly double its IPO price of $26 to close at $44.90. The IPO raised more than $2 billion making it the second largest Internet offering in the U.S. behind Facebook Inc. even beating out the Google launch in 2004 according to Thomson Reuters data. However, on the first trading day, the stock posted a bearish gravestone candlestick pattern, which was to accurately forecast the action to come. (Also note the bearish options trading activity on the stock immediately following its IPO shown in Figure 2). Part of the problem was that TWTR was "simply too expensive" according to one analyst's opinion who said on the day of the IPO that to justify a price of $45/share the company would have to generate income of $6 billion by 2018 which he believed "would seem too optimistic" (see Suggested Reading). However, investors disagreed and after dropping to a low of $38.80 on November 25, 2013, TWTR had nearly doubled in price by the last week in December above $73 when the blush appears to have come off the rose. Between December 2013 and May 2014, TWTR shares dropped more than 60%, hitting a low of $29.51. |
|
| Figure 1 � Daily chart showing the action on Twitter since its IPO together with the its industry chart (blue line). |
| Graphic provided by: TC2000.com. |
| |
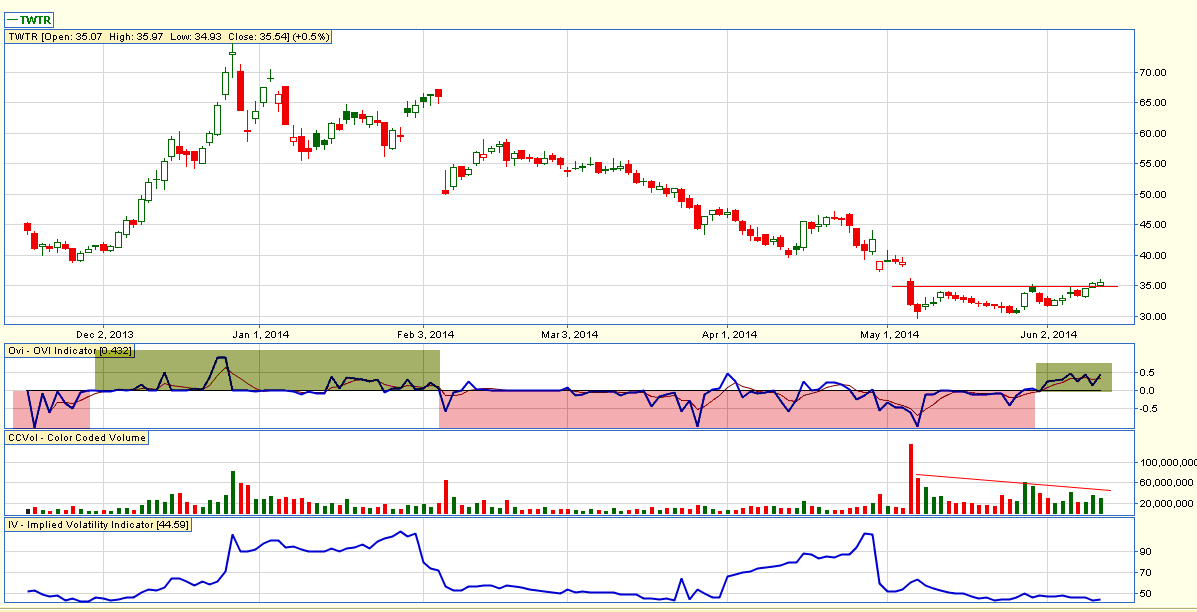
| But then something very interesting began to occur. After hitting a low of $29.51 on May 7, 2014 accompanied by extreme selling volume, which was evidence of investor capitulation, the stock put in a higher low of $30.38 on May 27, 2014 accompanied by lower (buying) volume — both factors provided proof that sellers were being replaced by buyers and stock accumulation was underway. In the process, TWTR posted an almost classic bullish double bottom chart pattern complete with a consolidation pattern of declining volume from the capitulation point. This evidence is supported in Figure 2 in the OVI indicator chart (middle) window which shows options activity on the stock. Areas marked in red show predominantly negative options activity (OVI < 0) and green, mostly positive (OVI > 0). Note that options traders became decidedly bullish in early May on the stock. |
|
| Figure 2 � Daily chart of Twitter showing the OVI indicator, which shows how options traders are placing bets on the stock since its IPO in November 2013 together with the recent double bottom and volume pattern characteristic of a period of consolidation. |
| Graphic provided by: www.ovitradersclub.com. |
| |
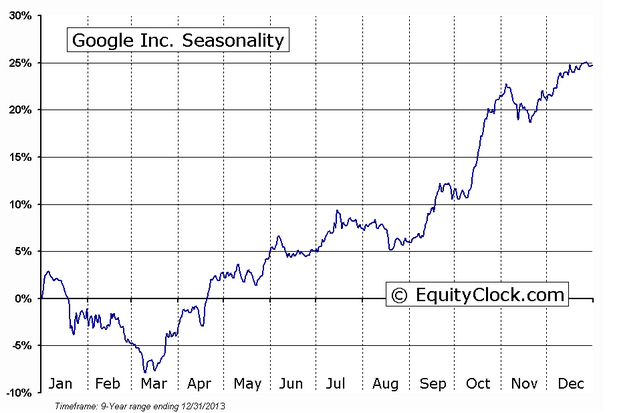
| Another bullish factor for TWTR and other stocks in the Internet Content and Information space is the seasonal effect on the industry. In the next chart we see a composite nine-year chart of Google, by far the largest and most influential company in this space, showing an average seasonal rise of 20% from June to year-end. |
|
| Figure 3 � Seasonal chart of Google, the largest Internet Content and Information stock in this space, showing the best and worst times to hold the stock over its nine-year life span. |
| Graphic provided by: www.equityclock.com. |
| |
| The technicals may look positive but the picture for TWTR isn't all blue sky. As of the latest earnings report (Q1-2014), the company was losing $0.22/share so will have to start making money to justify a higher stock price going forward. According to Zacks Investment Research, TWTR is forecasted to have an even larger loss of $0.29/share for Q2-2014 due to be reported July 29, 2014. |
| It is clear from the recent trading activity that equity and options traders as well as investors are bullish on the stock as the recent double bottom chart pattern would seem to indicate. Industry seasonals are also positive. TWTR has been showing bullish activity, rising on down market days but traders should keep stops tight and watch volume closely for confirmation that this up move is sustainable. Suggested Reading: Twitter Shares Soar In Frenzied NYSE Debut Twitter Earnings Information And Forecasts The OVI Indicator Explained |
Matt Blackman is a full-time technical and financial writer and trader. He produces corporate and financial newsletters, and assists clients in getting published in the mainstream media. He is the host of TradeSystemGuru.com. Matt has earned the Chartered Market Technician (CMT) designation. Find out what stocks and futures Matt is watching on Twitter at www.twitter.com/RatioTrade
| Company: | TradeSystemGuru.com |
| Address: | Box 2589 |
| Garibaldi Highlands, BC Canada | |
| Phone # for sales: | 604-898-9069 |
| Fax: | 604-898-9069 |
| Website: | www.tradesystemguru.com |
| E-mail address: | indextradermb@gmail.com |
Traders' Resource Links | |
| TradeSystemGuru.com has not added any product or service information to TRADERS' RESOURCE. | |
Click here for more information about our publications!
Comments

Request Information From Our Sponsors
- StockCharts.com, Inc.
- Candle Patterns
- Candlestick Charting Explained
- Intermarket Technical Analysis
- John Murphy on Chart Analysis
- John Murphy's Chart Pattern Recognition
- John Murphy's Market Message
- MurphyExplainsMarketAnalysis-Intermarket Analysis
- MurphyExplainsMarketAnalysis-Visual Analysis
- StockCharts.com
- Technical Analysis of the Financial Markets
- The Visual Investor
- VectorVest, Inc.
- Executive Premier Workshop
- One-Day Options Course
- OptionsPro
- Retirement Income Workshop
- Sure-Fire Trading Systems (VectorVest, Inc.)
- Trading as a Business Workshop
- VectorVest 7 EOD
- VectorVest 7 RealTime/IntraDay
- VectorVest AutoTester
- VectorVest Educational Services
- VectorVest OnLine
- VectorVest Options Analyzer
- VectorVest ProGraphics v6.0
- VectorVest ProTrader 7
- VectorVest RealTime Derby Tool
- VectorVest Simulator
- VectorVest Variator
- VectorVest Watchdog