HOT TOPICS LIST
- MACD
- Fibonacci
- RSI
- Gann
- ADXR
- Stochastics
- Volume
- Triangles
- Futures
- Cycles
- Volatility
- ZIGZAG
- MESA
- Retracement
- Aroon
INDICATORS LIST
LIST OF TOPICS
PRINT THIS ARTICLE
by Koos van der Merwe
With solar panels becoming more efficient, is it time to invest in Solar City?
Position: Buy
Koos van der Merwe
Has been a technical analyst since 1969, and has worked as a futures and options trader with First Financial Futures in Johannesburg, South Africa.
PRINT THIS ARTICLE
ELLIOTT WAVE
Is It Time To Buy Solar City?
06/13/14 03:53:59 PMby Koos van der Merwe
With solar panels becoming more efficient, is it time to invest in Solar City?
Position: Buy
| Solar panels have been around for many years. We all know what they look like. They provide clean energy, something Al Gore, in his fight against global warming, has been pushing for over the years. The company boasts that "it gives customers control of their energy costs to protect them from rising rates." Does it mean it is time to buy the share for a long-term hold? Let's see what the charts say. |

|
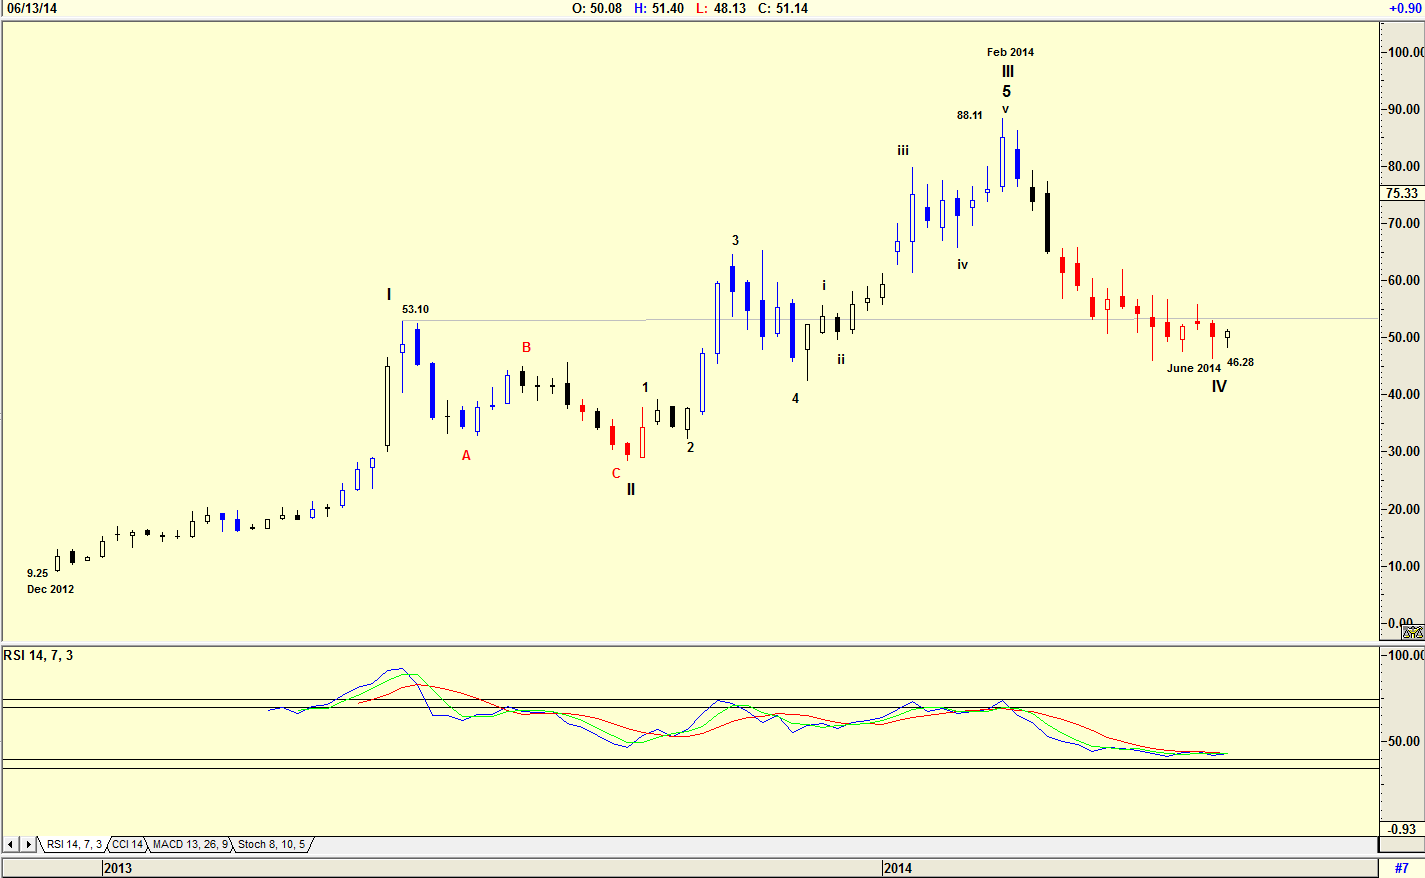
| Figure 1. Weekly chart with Elliott Wave count. |
| Graphic provided by: AdvancedGET. |
| |
| The chart in Figure 1 is a weekly chart and shows how the share price rose from a low of $9.25 in December 2012 to a high of $88.11 by February 2014. A preliminary Elliott Wave count suggests that the share price could be completing a WAVE IV low. Why preliminary? An Elliott Wave is a signpost in the wilderness that can change its count a little way down the road. On the chart, the WAVE IV low is below the high of WAVE I which is not in line with Elliott Wave rules. Exceptions do exist, but it is better to be cautious than err. Also note the RSI index which is not in oversold territory, suggesting a possible buy. Depending on what happens you could therefore see a change in the Elliott Wave count. |

|
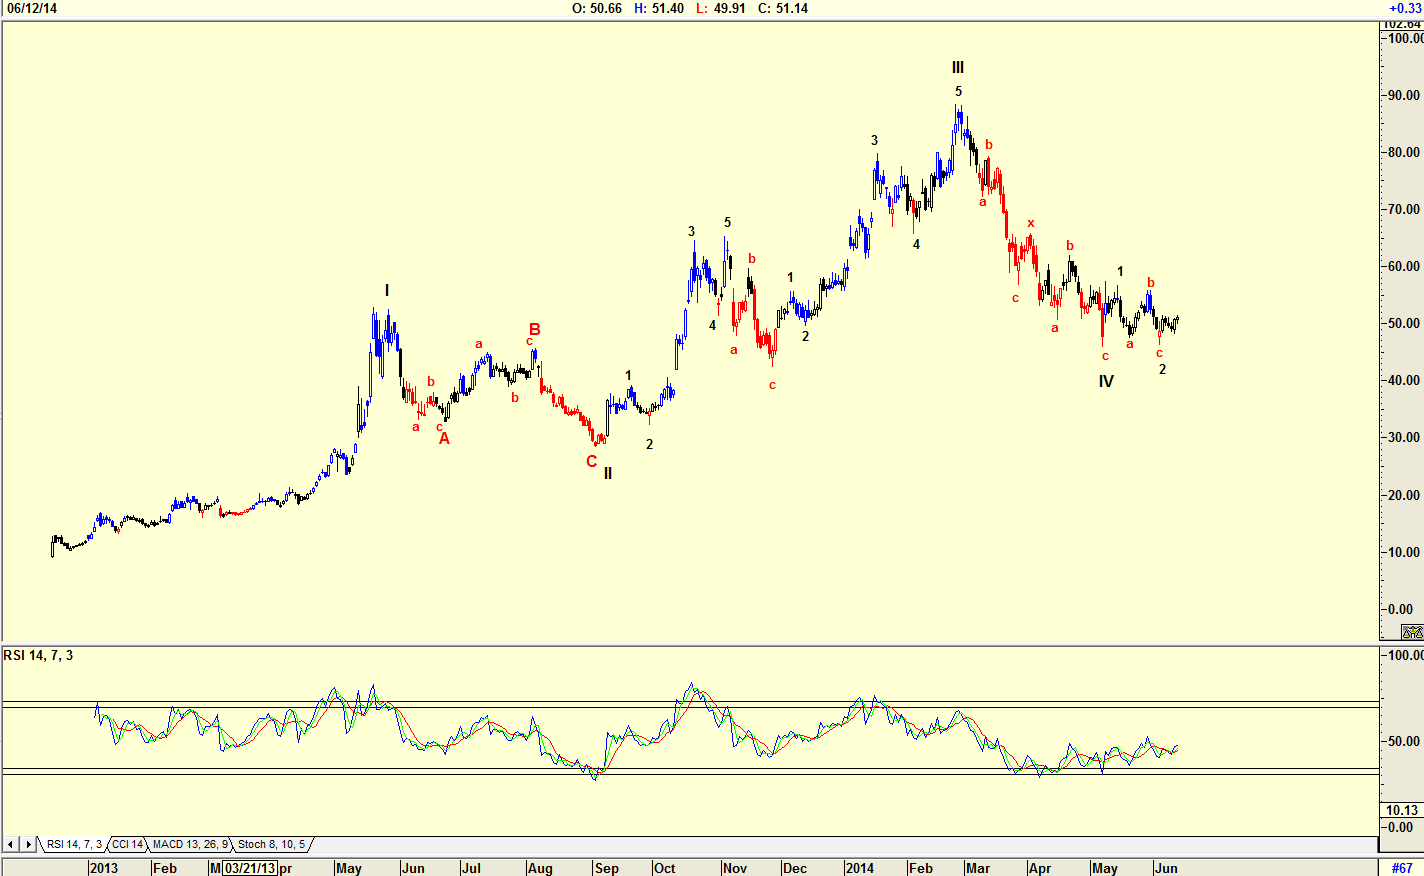
| Figure 2. Daily chart with Elliott Wave count and RSI indicator suggesting a buy. |
| Graphic provided by: AdvancedGET. |
| |
| The daily chart in Figure 2 suggests a similar Elliott Wave count as shown in the weekly chart in Figure 1. The chart is suggesting that the share price could now be moving into a Wave 3 of WAVE V. This is confirmed by the RSI which has given a buy signal and is moving up. |

|
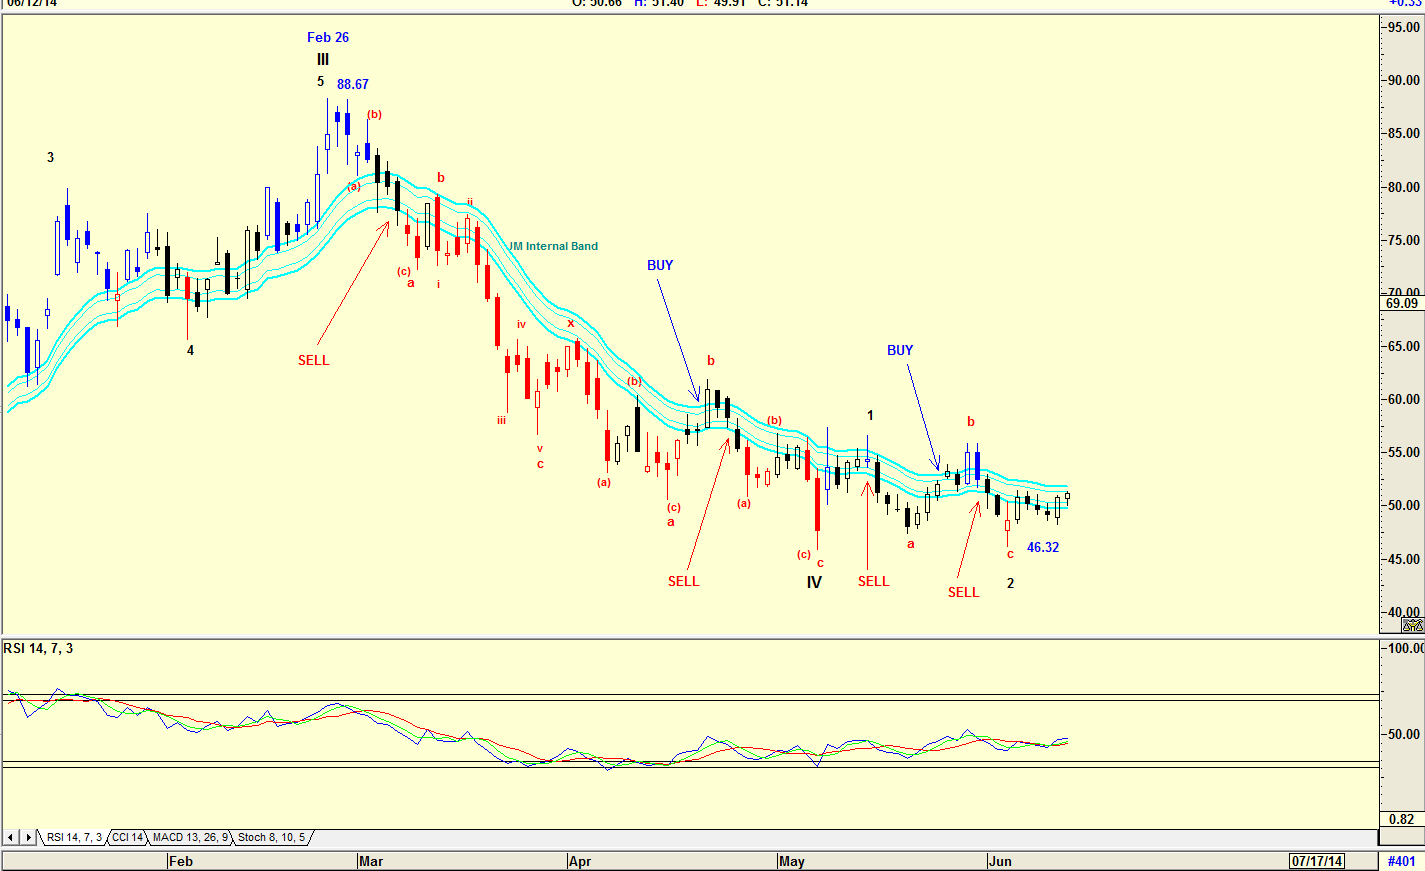
| Figure 3. Daily chart with JM Internal Band Indicator. |
| Graphic provided by: AdvancedGET. |
| |
| The chart in Figure 3 is a daily chart showing the JM Internal Band indicator. A JM Internal Band is a 15-period simple moving average offset by 2% positive and 2% negative. A move above the upper band signals a buy, and a move below the lower band signals a sell as shown on the chart. The share price has not given a fresh buy signal, and conservative investors could wait until it does before buying the share. The chart however, shows a larger degree of movement around the JM internal Band than average, so there could be a degree of risk, but with a positive RSI indicator, and an Elliott wave count suggesting a rise into a Wave 3 of WAVE V, you could take the risk. A Wave 5 by Elliott Wave rules should be equal to Wave 1. However, with WAVE IV being a dramatic correction from $88.67 to $46.32, and the length of WAVE I being 43.85, (53.10 - 9.25 = 43.85) the target for WAVE V is 90.17, (46.32+43.85=90.17). With a major resistance at $88.67, the high of February 26, 2014, you should set the target at $88.67. The chart pattern also looks as though it could be tracing a saucer formation, which means that the upside correction will be slow. Nevertheless, a buy for the long-term could be a profitable strategy. |
Has been a technical analyst since 1969, and has worked as a futures and options trader with First Financial Futures in Johannesburg, South Africa.
| Address: | 3256 West 24th Ave |
| Vancouver, BC | |
| Phone # for sales: | 6042634214 |
| E-mail address: | petroosp@gmail.com |
Click here for more information about our publications!
PRINT THIS ARTICLE

Request Information From Our Sponsors
- StockCharts.com, Inc.
- Candle Patterns
- Candlestick Charting Explained
- Intermarket Technical Analysis
- John Murphy on Chart Analysis
- John Murphy's Chart Pattern Recognition
- John Murphy's Market Message
- MurphyExplainsMarketAnalysis-Intermarket Analysis
- MurphyExplainsMarketAnalysis-Visual Analysis
- StockCharts.com
- Technical Analysis of the Financial Markets
- The Visual Investor
- VectorVest, Inc.
- Executive Premier Workshop
- One-Day Options Course
- OptionsPro
- Retirement Income Workshop
- Sure-Fire Trading Systems (VectorVest, Inc.)
- Trading as a Business Workshop
- VectorVest 7 EOD
- VectorVest 7 RealTime/IntraDay
- VectorVest AutoTester
- VectorVest Educational Services
- VectorVest OnLine
- VectorVest Options Analyzer
- VectorVest ProGraphics v6.0
- VectorVest ProTrader 7
- VectorVest RealTime Derby Tool
- VectorVest Simulator
- VectorVest Variator
- VectorVest Watchdog
