HOT TOPICS LIST
- MACD
- Fibonacci
- RSI
- Gann
- ADXR
- Stochastics
- Volume
- Triangles
- Futures
- Cycles
- Volatility
- ZIGZAG
- MESA
- Retracement
- Aroon
INDICATORS LIST
LIST OF TOPICS
PRINT THIS ARTICLE
by Koos van der Merwe
Back in 1968 when I first started using them, market charting and point and figure buy signals were not as self-fulfilling as they are in today's computerized society with its thousands of followers.
Position: Buy
Koos van der Merwe
Has been a technical analyst since 1969, and has worked as a futures and options trader with First Financial Futures in Johannesburg, South Africa.
PRINT THIS ARTICLE
POINT & FIGURE
Risk/Reward Using Point and Figure
10/24/02 03:07:56 PMby Koos van der Merwe
Back in 1968 when I first started using them, market charting and point and figure buy signals were not as self-fulfilling as they are in today's computerized society with its thousands of followers.
Position: Buy
| In 1968, when I discovered the stock market, I bought a book on point and figure charting by A.W. Cohen. I was hooked. Every morning I would wake at 6 am and religiously plot by hand all those companies that interested me, looking for buying opportunities. And yes, I did make money. Although today I do most of my charting with Advanced GET and use Technifilter Plus for indepth analysis and optimization, I still turn to point and figure charts to determine a price target. Perhaps this is a difficult habit to break, or perhaps because of all the various target strategies available, I have found the horizontal and vertical counts of P&F the most reliable. |
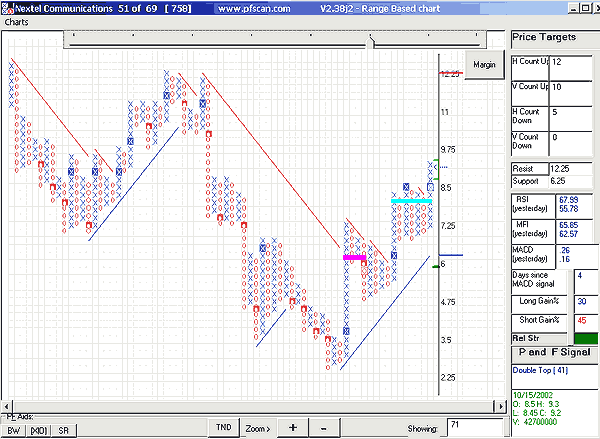
| In the chart below of Nextel Communications (NXTL), to calculate the horizontal and vertical counts I used the program PF Scan. It calculates its own box. In this chart 1 box = 0.25C. The reversal is 3 points. The moving averages for the MACD are set at 12, 26, and 9. The horizontal and vertical counts work as follows: Look for a breakout buy (sell) level, and count the number of squares horizontally from that level. Multiply this by the dollar value per square and again by the 3 point reversal. Add this figure to the dollar value at breakout buy for the horizontal count. This gives you the expected target. For the vertical target, count the number of squares of the column that are breaking out. Multiply this by the dollar value per square and by the 3 point reversal. Add this figure to the lowest dollar value of the column. This gives the target for verticle count. I have always found that a horizontal target count is more accurate than a verticle target count. By breaking above $8.50 NXTL has given a triple top buy signal, as you can see in the chart, with a target of $12 for the horizontal count and $10 for the vertical count (top right hand column - Price Targets). |

|
| Point and figure chart of Nextel Communications. |
| Graphic provided by: PFScan. |
| |
| I like to calculate a 2.5 : 1 risk strategy, meaning if I buy a stock and place a 5 percent stop-loss, I would like my target to be 12.5 percent (5% * 2.5). My risk/reward ratio is as follows: I purchased the stock at $8.60. My stop-loss of 5 percent is $0.43, so I would stop-out should the stock drop to $8.17. My target at a 2.5 risk/reward ratio would be $8.60 + ($0.43 * 2.5) = $8.60 + 1.075 = $9.675. The horizontal count target is $12 and the vertical count is $10, which meet my parameters, so I would buy the stock. |
| Finally, for reassurance, I would like the stock to perform better than an underlying index, in this case the Nasdaq. The green filling in relative strength index (Rel Str) box tells me that it indeed does. |
Has been a technical analyst since 1969, and has worked as a futures and options trader with First Financial Futures in Johannesburg, South Africa.
| Address: | 3256 West 24th Ave |
| Vancouver, BC | |
| Phone # for sales: | 6042634214 |
| E-mail address: | petroosp@gmail.com |
Click here for more information about our publications!
Comments
Date: 10/29/02Rank: 5Comment:
Date: 11/30/02Rank: 2Comment:
Date: 04/29/08Rank: 5Comment:

Request Information From Our Sponsors
- VectorVest, Inc.
- Executive Premier Workshop
- One-Day Options Course
- OptionsPro
- Retirement Income Workshop
- Sure-Fire Trading Systems (VectorVest, Inc.)
- Trading as a Business Workshop
- VectorVest 7 EOD
- VectorVest 7 RealTime/IntraDay
- VectorVest AutoTester
- VectorVest Educational Services
- VectorVest OnLine
- VectorVest Options Analyzer
- VectorVest ProGraphics v6.0
- VectorVest ProTrader 7
- VectorVest RealTime Derby Tool
- VectorVest Simulator
- VectorVest Variator
- VectorVest Watchdog
- StockCharts.com, Inc.
- Candle Patterns
- Candlestick Charting Explained
- Intermarket Technical Analysis
- John Murphy on Chart Analysis
- John Murphy's Chart Pattern Recognition
- John Murphy's Market Message
- MurphyExplainsMarketAnalysis-Intermarket Analysis
- MurphyExplainsMarketAnalysis-Visual Analysis
- StockCharts.com
- Technical Analysis of the Financial Markets
- The Visual Investor
