

HOT TOPICS LIST
- MACD
- Fibonacci
- RSI
- Gann
- ADXR
- Stochastics
- Volume
- Triangles
- Futures
- Cycles
- Volatility
- ZIGZAG
- MESA
- Retracement
- Aroon
INDICATORS LIST
LIST OF TOPICS
PRINT THIS ARTICLE
by Billy Williams
TransDigm Group Inc. has been riding the aerospace industry momentum but is now the time to enter? And, if not, when?
Position: Hold
Billy Williams
Billy Williams has been trading the markets for 27 years, specializing in momentum trading with stocks and options.
PRINT THIS ARTICLE
Big Development In The Works For TDG
06/12/14 05:37:11 PMby Billy Williams
TransDigm Group Inc. has been riding the aerospace industry momentum but is now the time to enter? And, if not, when?
Position: Hold
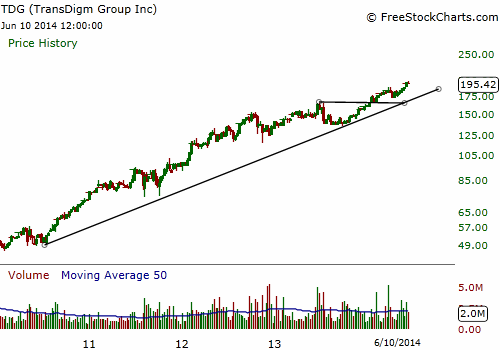
| TransDigm Group Incorporated (TDG) is a part of the aerospace industry which has weathered some of the steep market declines within the last several years yet has still managed to keep trading higher. Recently, TDG managed to recover from another decline and go on to trade up to an all-time high. Prices trading at all-time highs indicate the high probability that a stock will move even higher but there are key factors to keep in mind. These factors may indicate that now is a time to take profits and/or sit back and wait before taking a position in TDG. A quick glance at the monthly or weekly (Figure 1) price charts show that TDG's primary trend is bullish and that the smart money plays to the upside. The long-term trend has been relatively smooth as TDG has traded higher on a steady series of higher highs and higher lows allowing for brief periods where price corrections took place but the stock's price still held tight nears its all-time highs. |
|
| Figure 1: TDG's weekly chart shows a strong bullish trend in force for the last several years. With a strong trend in place, the stock looks ripe for a long entry but there are other factors to consider before jumping into a position. |
| Graphic provided by: www.freestockcharts.com. |
| |
| Chunking down to the daily charts reveals that for almost a year — October 2012 to September 2013 — TDG entered a period of contraction where price action was sloppy and punctuated by huge price gaps. Trying to trade within this range was a frustrating time for any trader who attempted it and, in fact, most traders avoided TDG altogether and looked for greener pastures in other industries whose stocks were more "trader friendly", offering better price trends and smoother price action. Still, despite the bumps in the road, TDG had a compelling long-term trend that spoke to technicians that it might be wise to jump on board the bullish trend. You had to have a combination of patience and discipline to time a good entry point. |
| On September 24, 2013, TDG bottomed out and began to trade higher to the top of its trading range, which was a resistance level at the $164 price point. TDG had no problem taking out its resistance point and climbed higher up and went as high as $196 recently. The dilemma now is whether to enter at this level or wait for a pullback. While price action favors the bulls, it remains that TDG has not had a price correction since the bottom reached on September 24, 2013 and TDG could be due for one in the near future. Every trend, after a good run, at some point, has a correction of 20% or more. Traders take profits and shake out the weaker players during these corrections. Afterwards, new money pours into the stock and it begins its resumption of the price move it had previously. This is a normal cycle that plays out over and over again unless in the stock unless the market sours on a stock and it falls out of favor completely. |
|
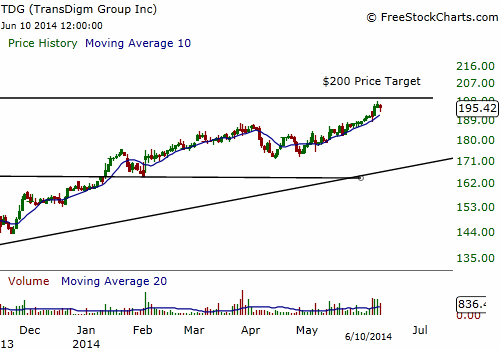
| Figure 2: TDG's price range suggests a $200 price target where a pullback or correction could take place. How the stock reacts at this level will reveal how to go about trading it from that point forward. |
| Graphic provided by: www.freestockcharts.com. |
| |
| As it stands, take notice of the high and low of TDG's trading range which it came out of prior to this bullish run. The bottom of the range is around $116 and the high of the range is around $158. The difference between the two points — $158 minus $116 — is 42 points. Add 42 to the top of the range at $158, then that gives you a price target of $200. This offers you a decent approximation of where price should pullback and where traders will begin to take profits. If you're going to play TDG, then wait for a pullback at this $200 price target and enter in the direction of the bullish trend (Figure 2). Presently, you have the overall market's winds at your back and the stock has a strong history of trending higher. You could even use call options or a bullish option spread to limit your risk. |
| You could also take a half position at the next pullback opportunity and as the stock proves itself by trading higher, you could add to your position and pyramid your way to a bigger position as the stock proves itself. If TDG fails to trade higher, you still limit your risk exposure by playing it safe but are still in a position to win if it goes your way. |
Billy Williams has been trading the markets for 27 years, specializing in momentum trading with stocks and options.
| Company: | StockOptionSystem.com |
| E-mail address: | stockoptionsystem.com@gmail.com |
Traders' Resource Links | |
| StockOptionSystem.com has not added any product or service information to TRADERS' RESOURCE. | |
Click here for more information about our publications!
PRINT THIS ARTICLE

Request Information From Our Sponsors
- VectorVest, Inc.
- Executive Premier Workshop
- One-Day Options Course
- OptionsPro
- Retirement Income Workshop
- Sure-Fire Trading Systems (VectorVest, Inc.)
- Trading as a Business Workshop
- VectorVest 7 EOD
- VectorVest 7 RealTime/IntraDay
- VectorVest AutoTester
- VectorVest Educational Services
- VectorVest OnLine
- VectorVest Options Analyzer
- VectorVest ProGraphics v6.0
- VectorVest ProTrader 7
- VectorVest RealTime Derby Tool
- VectorVest Simulator
- VectorVest Variator
- VectorVest Watchdog
- StockCharts.com, Inc.
- Candle Patterns
- Candlestick Charting Explained
- Intermarket Technical Analysis
- John Murphy on Chart Analysis
- John Murphy's Chart Pattern Recognition
- John Murphy's Market Message
- MurphyExplainsMarketAnalysis-Intermarket Analysis
- MurphyExplainsMarketAnalysis-Visual Analysis
- StockCharts.com
- Technical Analysis of the Financial Markets
- The Visual Investor