

HOT TOPICS LIST
- MACD
- Fibonacci
- RSI
- Gann
- ADXR
- Stochastics
- Volume
- Triangles
- Futures
- Cycles
- Volatility
- ZIGZAG
- MESA
- Retracement
- Aroon
INDICATORS LIST
LIST OF TOPICS
PRINT THIS ARTICLE
by Donald W. Pendergast, Jr.
After taking a rest from its powerful eight-month-long rally in 2013/2014, shares of Facebook (FB) are alive and kicking, once again.
Position: N/A
Donald W. Pendergast, Jr.
Freelance financial markets writer and online publisher of the Trendzetterz.com S&P 500 Weekly Forecast service.
PRINT THIS ARTICLE
TECHNICAL ANALYSIS
Facebook: Gathering Steam Again
06/12/14 04:31:10 PMby Donald W. Pendergast, Jr.
After taking a rest from its powerful eight-month-long rally in 2013/2014, shares of Facebook (FB) are alive and kicking, once again.
Position: N/A
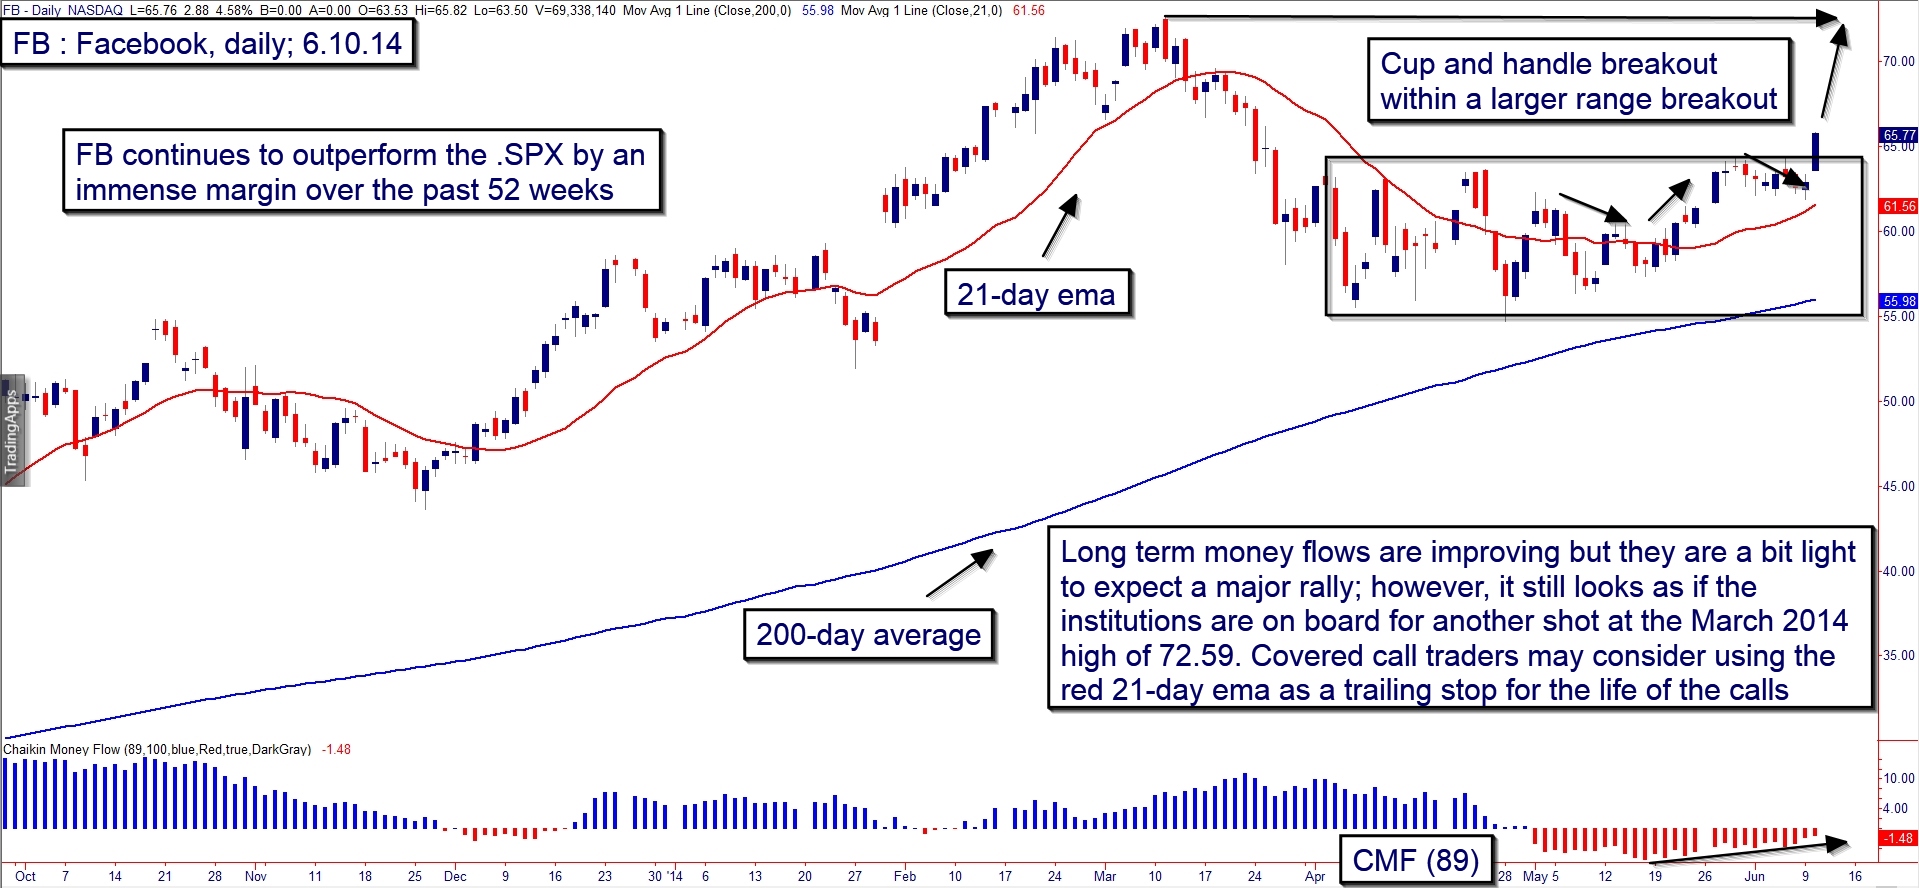
| With the so-called 'perma-bears' still awaiting their long anticipated correction of the 2009-2014 bull market, opportunistic traders with an open mind keep finding attractive new long trading opportunities. Here's a look now at a low-risk, high probability long setup in Facebook. |
|
| Figure 1. Facebook (FB): Low risk, high probability long trade setups come in several varieties, and this looks like a dandy; expect FB to have an easy run up toward its March 2014 swing high of 72.59. |
| Graphic provided by: TradeStation. |
| |
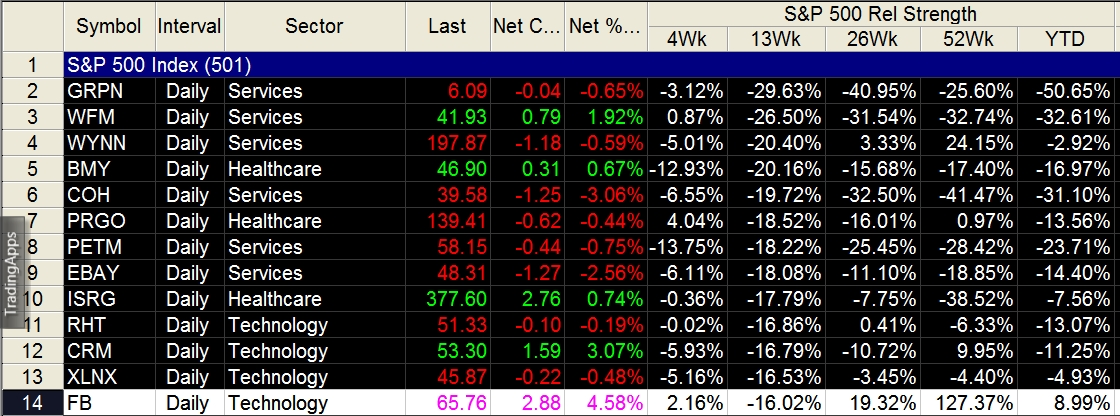
| It's been more than two years since Facebook's initial public offering of stock (IPO); after a rough start in mid-2012, FB has shown itself to be a good trading vehicle — especially on the long side — that can move in sustained swing and trend moves. That's why this new long trade setup in FB takes on extra significance, giving it an even more favorable risk/reward ratio (see Figure 1): 1. The three month long pullback from the March 2014 swing high was of a proportional rather than a panic nature. 2. Long-term Chaikin Money Flow (CMF)(89) did dip into negative territory on the decline but has begun to trend higher. 3. A beautiful cup & handle pattern has just been successfully resolved to the upside — a reliably bullish pattern that was also part of a larger rectangle/consolidation pattern. 4. The 200-day simple moving average (SMA) is still sloping higher and was not seriously challenged during the recent weak spell in the stock. 5. FB is absolutely decimating the S&P 500 index (.SPX) in terms of comparative relative strength over the past 52 week period; mutual funds and the rest of the big money players in the market tend to prefer stocks that are outperforming, rather than under-performing the broad market indexes. Nothing in trading, investing — or even life itself — is guaranteed, but from just about any rational perspective, the fresh cup & handle/consolidation breakout in FB looks like a high probability long play, one that should have little, if any problem reaching the March 2014 highs of 72.59 soon. |
|
| Figure 2. FB is outperforming the .SPX by a wide margin over the past 52 weeks. |
| Graphic provided by: TradeStation. |
| Graphic provided by: TradeStation RadarScreen. |
| |
| Traders can go the covered call route here, and this looks very attractive: For every 100 shares of FB you acquire, sell one July '14 $65.00 call option; if the shares are called away at expiration, you stand to make about $250 per covered call (a gain of nearly 4% or 45% annualized) for a 5 1/2 week commitment of time and risk capital. The red 21-day exponential moving average (EMA) on the chart can be used as an effective trailing stop for covered call trades making high probability pattern breakouts. If FB closes below the EMA, bail out on both sides of the trade, but for as long as it stays above, hold the trade until July expiration. For swing traders, go long on a rise above 65.82 and manage the trade with a three-bar trailing stop of the daily lows; if FB gets close to the March high of 72.59, consider taking at least half profits and trailing the rest, using the same three-bar stop. Since this is a high probability long pattern breakout, this is one of the times that a 2% account risk can be taken, depending on a trader's skill level, of course. Trade and invest wisely until we meet here again. |
Freelance financial markets writer and online publisher of the Trendzetterz.com S&P 500 Weekly Forecast service.
| Title: | Market consultant and writer |
| Company: | Trendzetterz |
| Address: | 81 Hickory Hollow Drive |
| Crossville, TN 38555 | |
| Phone # for sales: | 904-303-4814 |
| Website: | trendzetterz.com |
| E-mail address: | support@trendzetterz.com |
Traders' Resource Links | |
| Trendzetterz has not added any product or service information to TRADERS' RESOURCE. | |
Click here for more information about our publications!
PRINT THIS ARTICLE

Request Information From Our Sponsors
- StockCharts.com, Inc.
- Candle Patterns
- Candlestick Charting Explained
- Intermarket Technical Analysis
- John Murphy on Chart Analysis
- John Murphy's Chart Pattern Recognition
- John Murphy's Market Message
- MurphyExplainsMarketAnalysis-Intermarket Analysis
- MurphyExplainsMarketAnalysis-Visual Analysis
- StockCharts.com
- Technical Analysis of the Financial Markets
- The Visual Investor
- VectorVest, Inc.
- Executive Premier Workshop
- One-Day Options Course
- OptionsPro
- Retirement Income Workshop
- Sure-Fire Trading Systems (VectorVest, Inc.)
- Trading as a Business Workshop
- VectorVest 7 EOD
- VectorVest 7 RealTime/IntraDay
- VectorVest AutoTester
- VectorVest Educational Services
- VectorVest OnLine
- VectorVest Options Analyzer
- VectorVest ProGraphics v6.0
- VectorVest ProTrader 7
- VectorVest RealTime Derby Tool
- VectorVest Simulator
- VectorVest Variator
- VectorVest Watchdog