

HOT TOPICS LIST
- MACD
- Fibonacci
- RSI
- Gann
- ADXR
- Stochastics
- Volume
- Triangles
- Futures
- Cycles
- Volatility
- ZIGZAG
- MESA
- Retracement
- Aroon
INDICATORS LIST
LIST OF TOPICS
PRINT THIS ARTICLE
by Donald W. Pendergast, Jr.
Down more than 50% year to date, shares of Groupon Inc. may now be providing traders with the first meaningful signs that a complete bullish reversal is soon to be seen. Here's a closer look .
Position: N/A
Donald W. Pendergast, Jr.
Freelance financial markets writer and online publisher of the Trendzetterz.com S&P 500 Weekly Forecast service.
PRINT THIS ARTICLE
RESISTANCE LINE
Groupon (GRPN): Regrouping After A Six-Month Slide?
06/11/14 04:34:49 PMby Donald W. Pendergast, Jr.
Down more than 50% year to date, shares of Groupon Inc. may now be providing traders with the first meaningful signs that a complete bullish reversal is soon to be seen. Here's a closer look .
Position: N/A
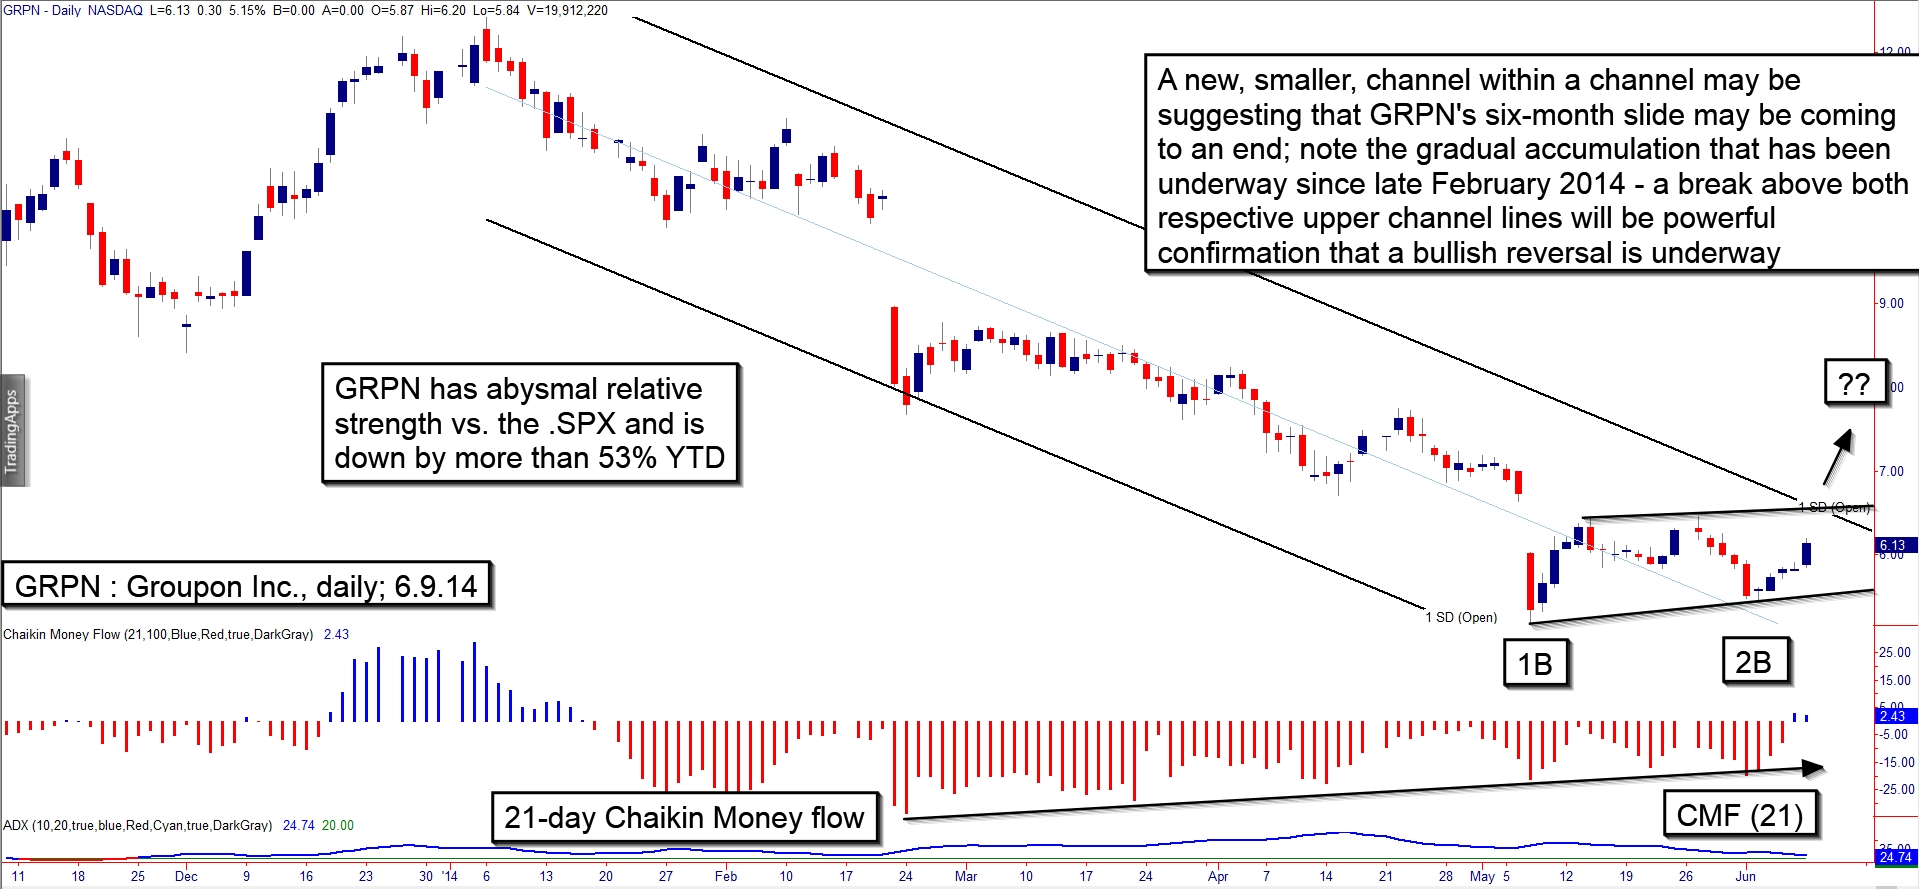
| Shares of Groupon Inc. (GRPN) had a terrific run from late 2012 to late 2013, rallying all the way from 2.60 to 12.76 — for a gain of 390% — but have stumbled badly since making a failed attempt at a new high since January 2014 (Figure 1). This stock trends pretty well on its daily time frame, and there are a number of trend following systems that would have done a fine job of capturing profits in GRPN during its big run higher as well as its 53% decline since the beginning of the year. Such systems can be built with moving averages, volatility trailing stops, price channels or even Keltner Channels and all would have made money in this stock, especially if proper back/forward testing protocols were employed in the testing process to locate a stable set of entry/exit trigger parameters. Currently, GRPN is still short, based on a standard TradeStation moving average ribbon template, and the hypothetical open gains are close to 30% since mid-February 2014. However, if you take another view of the stock, this time using a linear regression channel and the pattern forming inside it, you find that the downtrend may be flashing advance warning that a trend reversal may be imminent. |
|
| Figure 1. Groupon Inc. (GRPN): With a bullish money flow divergence in place for more than three months now, the price action within the large and small channel patterns suggest that the line of least resistance in GRPN is toward higher prices. |
| Graphic provided by: TradeStation. |
| |
| The regression channel is rooted in the January 6, 2014 (12.76) swing high and the May 7, 2014 swing low (5.18) and is set to one standard deviation. It's the recent action at the bottom of the channel that is of such interest here: 1. A double bottom pattern has formed, with the first low in the lower half of the channel and the second low in the upper half of the channel. 2. A new, smaller channel can now be drawn over the price action connecting the double bottom pattern. Note that it will only take a modest bullish breakout for GRPN to break beyond the upper channel lines of the large and small channel patterns. This is 'uber' bullish and is one of the surest signs that suggest GRPN should have a strong bullish reversal soon. 3. Finally, note the slow yet steady bullish price/money flow divergence pattern on the 21-day Chaikin Money Flow histogram (CMF)(21) since late February 2014; the big money players (mutual funds, big banks, hedge funds) have apparently begun to sniff a whiff of 'value' here in GRPN shares, and when the real bullish break arrives, they will be the ones ramping up the price with their massive buying power. |
|
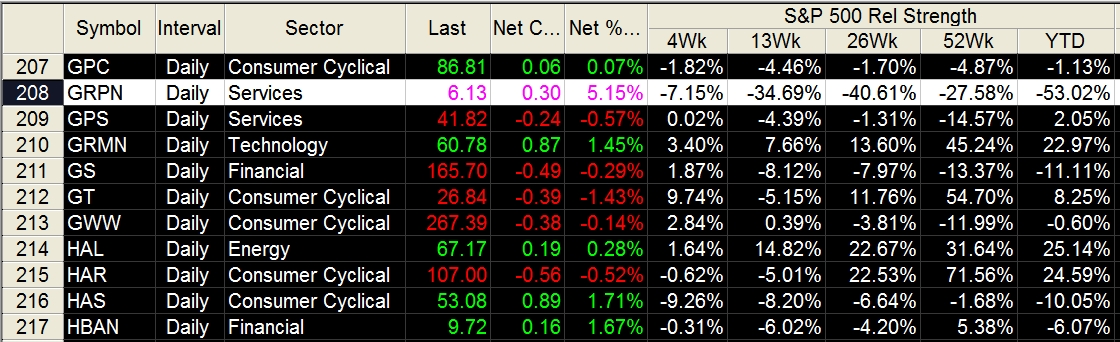
| Figure 2. GRPN has truly awful relative strength rankings versus the S&P 500 index (.SPX) across all major time periods, but that may change soon enough. |
| Graphic provided by: TradeStation. |
| Graphic provided by: TradeStation RadarScreen. |
| |
| This is a high probability reversal setup to be sure, but seeing as reversals can have some back and fill action that make life tough for swing traders and trend followers alike, perhaps the best way to play a double channel line break in GRPN is to sell near-term put options. Here's how: A. On a break above 6.50, sell the July '14 GRPN $6.00 put option(s) for the going rate at the time and look to hold on until the put either declines in value by 50 to 60% or it increases in value by 80 to 90%. B. One of the cool things here is the twin channel lines that will be the trade trigger; these may very well act as support on a subsequent pullback by GRPN after the initial breakout move, and the resulting support area will be well above the $6.00 strike price of the puts. If you are a skilled put seller, you might go ahead and risk no more than 2% of your account value on this setup; if you are less skilled, you may want to risk 1% maximum and use the trade as a learning experience. This should be a good short put layup as long as the break above the channel lines happens within the next three to seven trading sessions. Trade and invest wisely until we meet here again. |
Freelance financial markets writer and online publisher of the Trendzetterz.com S&P 500 Weekly Forecast service.
| Title: | Market consultant and writer |
| Company: | Trendzetterz |
| Address: | 81 Hickory Hollow Drive |
| Crossville, TN 38555 | |
| Phone # for sales: | 904-303-4814 |
| Website: | trendzetterz.com |
| E-mail address: | support@trendzetterz.com |
Traders' Resource Links | |
| Trendzetterz has not added any product or service information to TRADERS' RESOURCE. | |
Click here for more information about our publications!
Comments

Request Information From Our Sponsors
- StockCharts.com, Inc.
- Candle Patterns
- Candlestick Charting Explained
- Intermarket Technical Analysis
- John Murphy on Chart Analysis
- John Murphy's Chart Pattern Recognition
- John Murphy's Market Message
- MurphyExplainsMarketAnalysis-Intermarket Analysis
- MurphyExplainsMarketAnalysis-Visual Analysis
- StockCharts.com
- Technical Analysis of the Financial Markets
- The Visual Investor
- VectorVest, Inc.
- Executive Premier Workshop
- One-Day Options Course
- OptionsPro
- Retirement Income Workshop
- Sure-Fire Trading Systems (VectorVest, Inc.)
- Trading as a Business Workshop
- VectorVest 7 EOD
- VectorVest 7 RealTime/IntraDay
- VectorVest AutoTester
- VectorVest Educational Services
- VectorVest OnLine
- VectorVest Options Analyzer
- VectorVest ProGraphics v6.0
- VectorVest ProTrader 7
- VectorVest RealTime Derby Tool
- VectorVest Simulator
- VectorVest Variator
- VectorVest Watchdog