HOT TOPICS LIST
- MACD
- Fibonacci
- RSI
- Gann
- ADXR
- Stochastics
- Volume
- Triangles
- Futures
- Cycles
- Volatility
- ZIGZAG
- MESA
- Retracement
- Aroon
INDICATORS LIST
LIST OF TOPICS
PRINT THIS ARTICLE
by Koos van der Merwe
In late April, the iPhone and iPad maker announced plans to split its stock for the first time in nine years.
Position: Accumulate
Koos van der Merwe
Has been a technical analyst since 1969, and has worked as a futures and options trader with First Financial Futures in Johannesburg, South Africa.
PRINT THIS ARTICLE
ELLIOTT WAVE
The Apple Split
06/11/14 04:22:54 PMby Koos van der Merwe
In late April, the iPhone and iPad maker announced plans to split its stock for the first time in nine years.
Position: Accumulate
| When a company announces that it intends to split its shares, it is time to buy in the hope that at the lower share price more investors will start buying the share and the price will rise. The strategy is to buy the share when the announcement is made and to sell the share once the split occurs. Splits lower a stock's trading price by substantially increasing the number of outstanding shares. Even though the company's market value remains the same, the prospect of a lower price per share often excites investors who previously shied away from a stock because it looked too expensive. Apple is executing a 7-for-1 split. That means every AAPL stockholder gets six additional shares for every share they owned as of June 2, 2014. The lower price could clear the way for the company to be included among the 30 stocks in the Dow Jones Industrial Average. The Dow is supposed to mirror key sectors of the economy, a role that seems perfectly suited for AAPL given the popularity of the company's products and its $171 billion annual revenue. By buying AAPL before the split and selling after the split you are effectively buying in weakness and selling into strength. Did this happen with AAPL shares? |

|
| Figure 1. Weekly chart of Apple. |
| Graphic provided by: AdvancedGET. |
| |
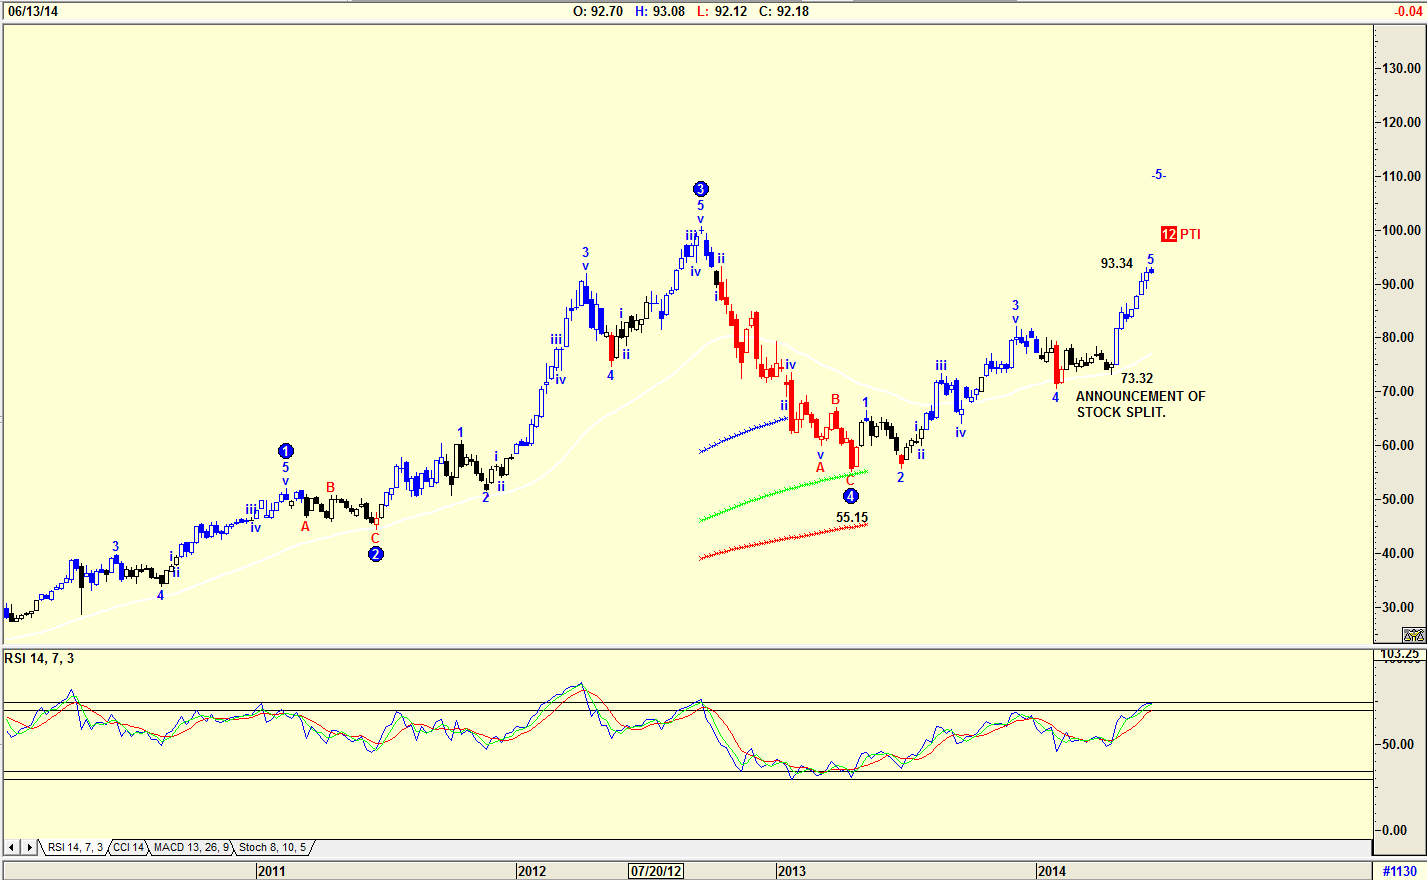
| The chart in Figure 1 is a weekly chart of AAPL, showing how the share price reacted to the announcement of the stock split. The share price at the time of the announcement was $513.24 ($73.32 after split) and you can see on the chart how the price rose rapidly to $93.34. The split became effective on June 9, 2014 and the share price dropped to $92-$93. Does this mean that the share price will fall further? The weekly chart seems to think so. With the PTI (Probability Index) at only 12 and with an RSI indicator at overbought levels, a fall in price to lower levels looks a certainty. |

|
| Figure 2. Daily chart of Apple. |
| Graphic provided by: AdvancedGET. |
| |
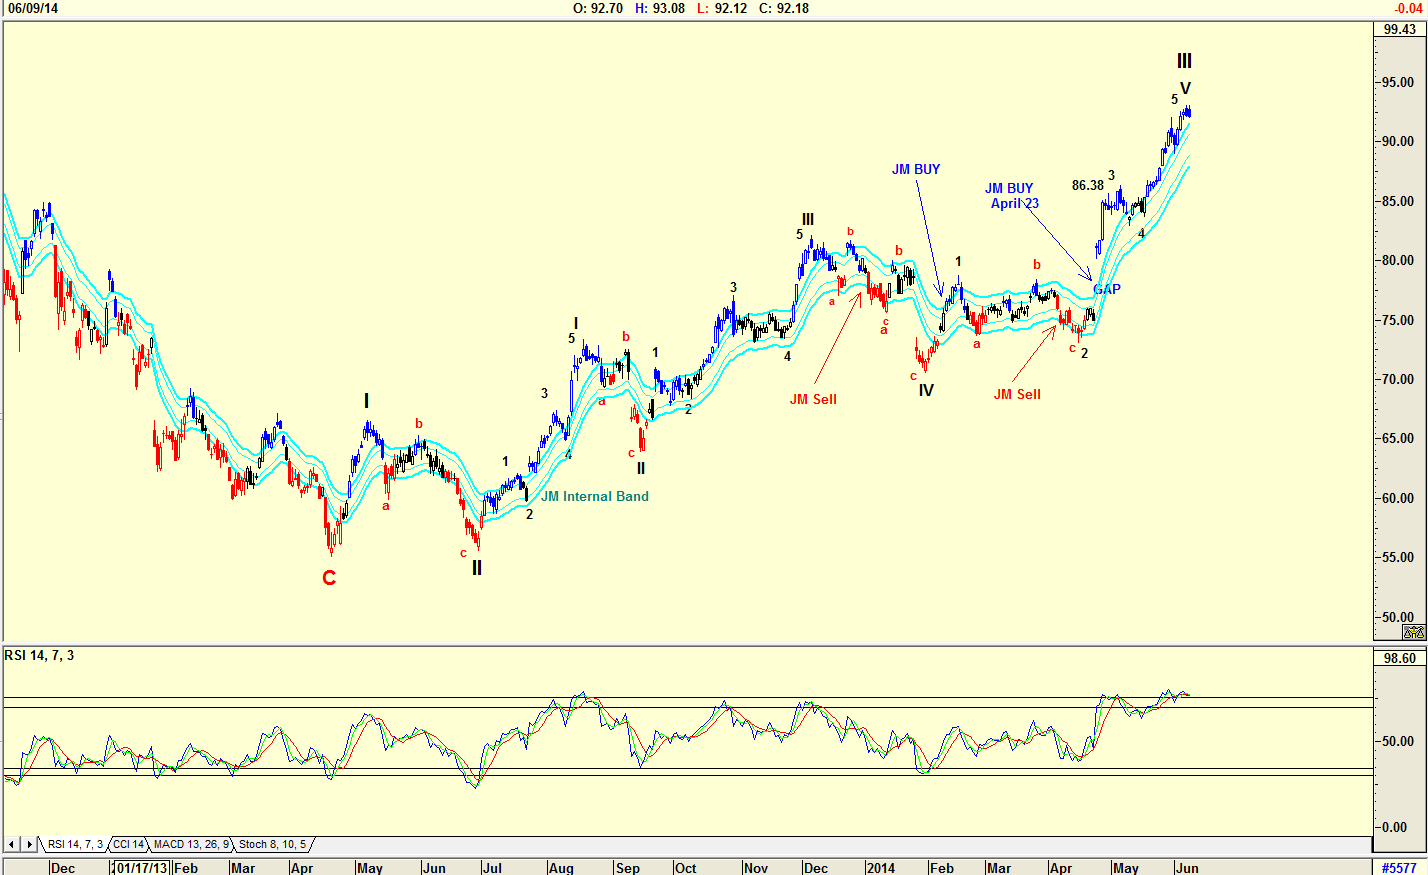
| The chart in Figure 2 is a daily chart with an Elliott Wave count suggesting that the share price is completing a Wave V of WAVE III. This should see the share price fall to $86.38, the 4th wave of lesser degree. The RSI is at overbought levels and is suggesting a correction. The share price is above the upper JM Internal Band indicator, having given a buy signal on April 23, 2014 when the split announcement was made. Note how the share price rose strongly on a gap. To buy AAPL at the current price is risky because many risk-takers bought the share when the split announcement was made because they figured that the share price would rise. They then sold on the day the split occurred. However, buying and holding the share on a correction with the hope that it would now be included in the Dow is tempting. I am inclined to believe the latter, and suggest that you should buy the share on a correction, possibly at the $92 level and holding for the long-term. |
Has been a technical analyst since 1969, and has worked as a futures and options trader with First Financial Futures in Johannesburg, South Africa.
| Address: | 3256 West 24th Ave |
| Vancouver, BC | |
| Phone # for sales: | 6042634214 |
| E-mail address: | petroosp@gmail.com |
Click here for more information about our publications!
PRINT THIS ARTICLE

Request Information From Our Sponsors
- StockCharts.com, Inc.
- Candle Patterns
- Candlestick Charting Explained
- Intermarket Technical Analysis
- John Murphy on Chart Analysis
- John Murphy's Chart Pattern Recognition
- John Murphy's Market Message
- MurphyExplainsMarketAnalysis-Intermarket Analysis
- MurphyExplainsMarketAnalysis-Visual Analysis
- StockCharts.com
- Technical Analysis of the Financial Markets
- The Visual Investor
- VectorVest, Inc.
- Executive Premier Workshop
- One-Day Options Course
- OptionsPro
- Retirement Income Workshop
- Sure-Fire Trading Systems (VectorVest, Inc.)
- Trading as a Business Workshop
- VectorVest 7 EOD
- VectorVest 7 RealTime/IntraDay
- VectorVest AutoTester
- VectorVest Educational Services
- VectorVest OnLine
- VectorVest Options Analyzer
- VectorVest ProGraphics v6.0
- VectorVest ProTrader 7
- VectorVest RealTime Derby Tool
- VectorVest Simulator
- VectorVest Variator
- VectorVest Watchdog
