

HOT TOPICS LIST
- MACD
- Fibonacci
- RSI
- Gann
- ADXR
- Stochastics
- Volume
- Triangles
- Futures
- Cycles
- Volatility
- ZIGZAG
- MESA
- Retracement
- Aroon
INDICATORS LIST
LIST OF TOPICS
PRINT THIS ARTICLE
by Donald W. Pendergast, Jr.
Shares of Broadcom Corp. have staged a massive bullish rally and should still have more upside into the summer of 2014.
Position: N/A
Donald W. Pendergast, Jr.
Freelance financial markets writer and online publisher of the Trendzetterz.com S&P 500 Weekly Forecast service.
PRINT THIS ARTICLE
BREAKOUTS
BRCM: More Upside After Breakout?
06/10/14 03:57:04 PMby Donald W. Pendergast, Jr.
Shares of Broadcom Corp. have staged a massive bullish rally and should still have more upside into the summer of 2014.
Position: N/A
| Back in the late 1990s, when I first began to use a high-quality charting/system testing platform, I noticed that I had a psychological bias against the "buy high and sell higher" methodology that certain momentum and even trend followers tend to rely on. It seemed more rational to rely on overbought/oversold oscillators and to always buy on weakness (pullbacks) rather than buy on strength (breakouts), right? More than 15 years later, I now understand that both styles of trading have their place and time to be employed; here's a look at a massive breakout in Broadcom Corp. (BRCM) along with a brief tutorial as to why this is not an overbought situation to be sold but rather a bullish momentum breakout move that can be played conservatively with a covered call. |
|
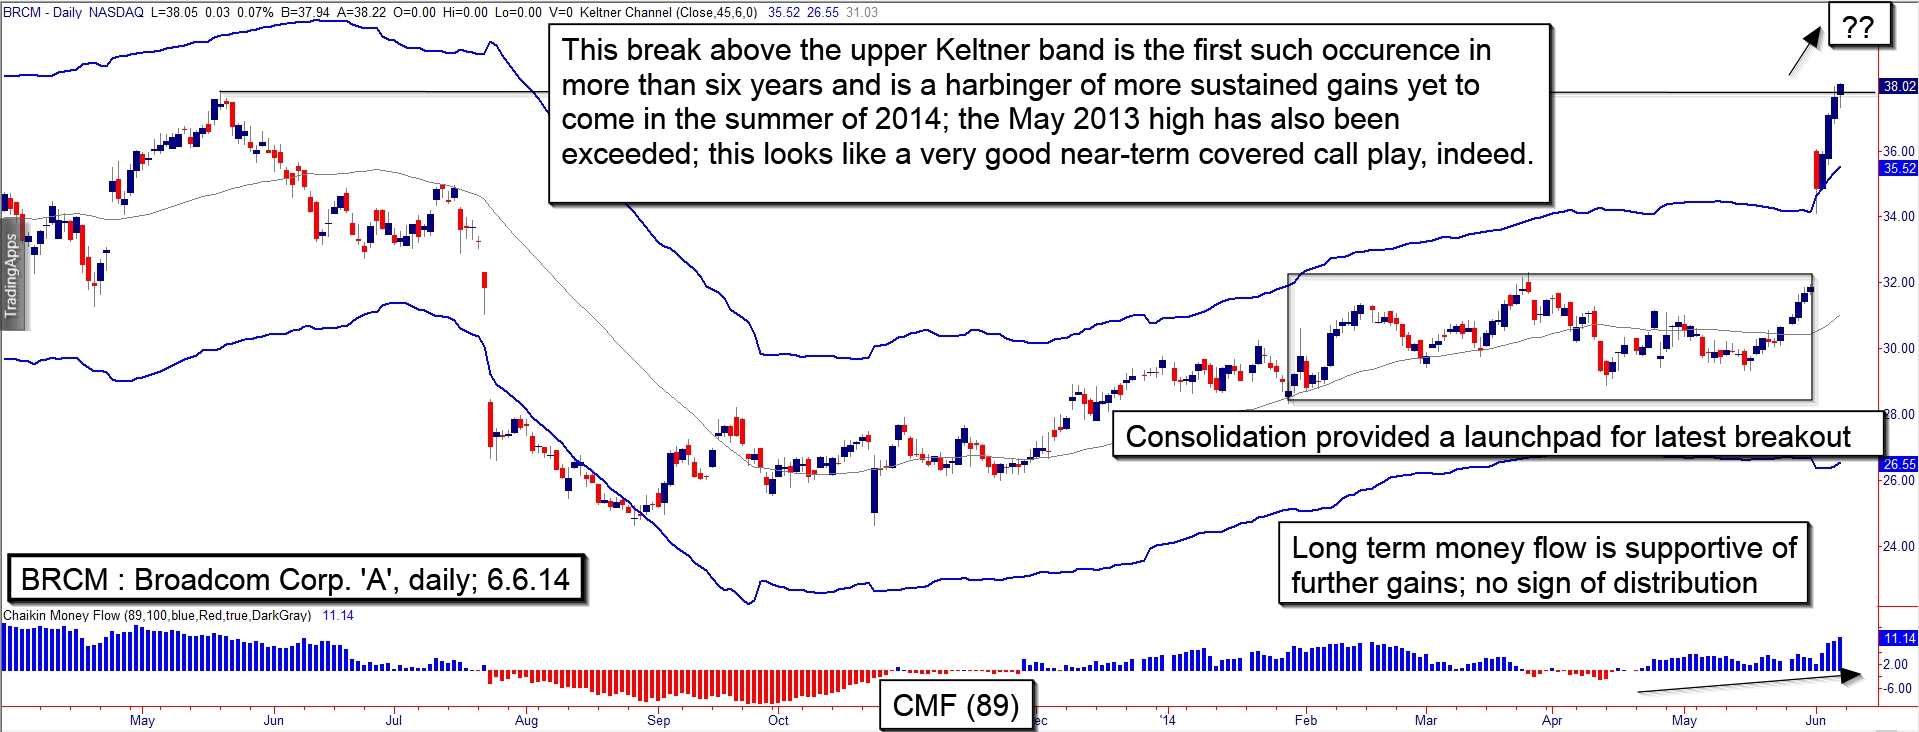
| Figure 1. Broadcom Corp. (BRCM): Most of the time, a tag of a wide-range Keltner band implies an upcoming reversal, but when you see a massive blast beyond the band — the biggest in more than 10 years — you may be witnessing a powerful continuation move. |
| Graphic provided by: TradeStation. |
| |
| Many times, when a stock hits a key support/resistance level such as a high-degree Keltner band (set at seven average true ranges away from a 40-period average) the stage becomes set for a near-term reversal or pullback. At other times, however, a tremendous thrust above/beyond an upper Keltner band normally signifies even more gains ahead, and here's why: 1. In the case of BRCM, you have to go back to April 2008 to identify the last time that the stock was able to close above the top band; clearly, this isn't an everyday kind of bullish breakout move. 2. Incredibly, BRCM's weekly chart (not shown) is very close to staging the same kind of Keltner break — for the first time since January 2006. 3. The 89-day Chaikin money flow (CMF)(89) on the daily chart (Figure 1) is super bullish, revealing that the "smart money" is fully on-board this rally. 4. The 34-week CMF is also heavily biased to the buy side of the equation. 5. BRCM has been outperforming the S&P 500 index (.SPX) over the past 4-, 13- and 26-week periods. Now, even though the 10-day RSI is reading a whopping 93.80, this does not mean that BRCM is overbought at all, as the RSI can, and will, stay at elevated levels during a powerfully bullish trend (and at ridiculously low levels in major bear trends). Given the weight of the bullish evidence already described, to attempt to go short BRCM on the daily time frame — expecting a quick selloff — would be akin to jumping out on to the San Bernardino freeway at the height of rush hour, expecting the cars and trucks to stop on a dime, just for you. It just ain't gonna happen. Now, of course, what you can do is wait for a bit of an intraday pullback to try and get a better entry price for a swing trade — which might or might not happen, depending on how aggressive the smart money is with their next round of BRCM purchases — or you can go the conservative trading route and play this emerging trend as a near-term covered call trade. |
|
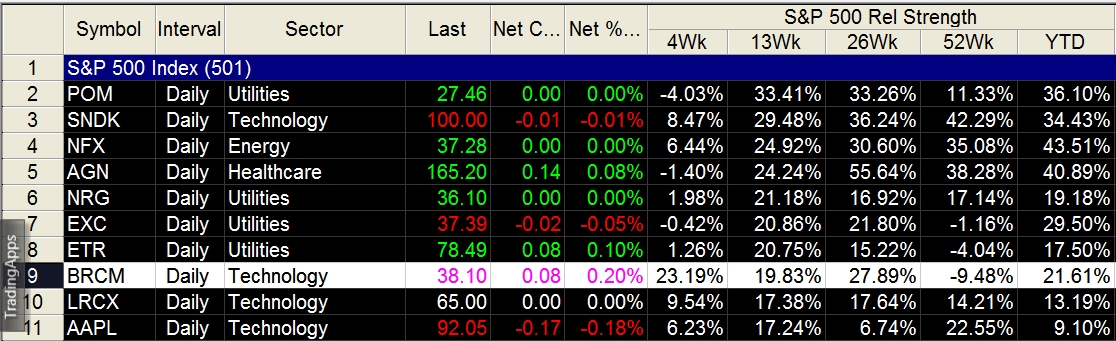
| Figure 2. The stock has been outperforming the .SPX by a wide margin over the past 4-, 13- and 26-week periods. |
| Graphic provided by: TradeStation. |
| Graphic provided by: TradeStation RadarScreen. |
| |
| Using the July '14 BRCM $36 calls looks like an attractive way to go the covered call route: 1. The calls are in-the-money- (ITM) and have a built-in price cushion to help guard against minor pullbacks against the trend. 2. Open interest is large, at 1,700-plus contracts. 3. With less than six weeks until expiration, daily time decay (theta) will begin to accelerate rapidly within the next two weeks. The nice thing with covered calls is that timing your entry point becomes less important, since you are, in essence, taking both sides of the trade (in varying degrees, to be sure). Traders can simply put the trade on as a complete unit (most quality trading platforms can easily accommodate this) or if they have a knack for market timing they can also put one side on at a time, trying to get slightly better prices. Once in, you can elect to manage the trade by using either a 13- or a 21-day exponential moving average (EMA); a daily close below it prior to expiration means you close out both sides of the trade. If BRCM remains above the EMA, simply hold it until expiration and make some money — about $45 per contract for every 100 shares of BRCM you own. Keep your account risk at 2% or less and remember to trade wisely until we meet here again. |
Freelance financial markets writer and online publisher of the Trendzetterz.com S&P 500 Weekly Forecast service.
| Title: | Market consultant and writer |
| Company: | Trendzetterz |
| Address: | 81 Hickory Hollow Drive |
| Crossville, TN 38555 | |
| Phone # for sales: | 904-303-4814 |
| Website: | trendzetterz.com |
| E-mail address: | support@trendzetterz.com |
Traders' Resource Links | |
| Trendzetterz has not added any product or service information to TRADERS' RESOURCE. | |
Click here for more information about our publications!
PRINT THIS ARTICLE

Request Information From Our Sponsors
- VectorVest, Inc.
- Executive Premier Workshop
- One-Day Options Course
- OptionsPro
- Retirement Income Workshop
- Sure-Fire Trading Systems (VectorVest, Inc.)
- Trading as a Business Workshop
- VectorVest 7 EOD
- VectorVest 7 RealTime/IntraDay
- VectorVest AutoTester
- VectorVest Educational Services
- VectorVest OnLine
- VectorVest Options Analyzer
- VectorVest ProGraphics v6.0
- VectorVest ProTrader 7
- VectorVest RealTime Derby Tool
- VectorVest Simulator
- VectorVest Variator
- VectorVest Watchdog
- StockCharts.com, Inc.
- Candle Patterns
- Candlestick Charting Explained
- Intermarket Technical Analysis
- John Murphy on Chart Analysis
- John Murphy's Chart Pattern Recognition
- John Murphy's Market Message
- MurphyExplainsMarketAnalysis-Intermarket Analysis
- MurphyExplainsMarketAnalysis-Visual Analysis
- StockCharts.com
- Technical Analysis of the Financial Markets
- The Visual Investor