HOT TOPICS LIST
- MACD
- Fibonacci
- RSI
- Gann
- ADXR
- Stochastics
- Volume
- Triangles
- Futures
- Cycles
- Volatility
- ZIGZAG
- MESA
- Retracement
- Aroon
INDICATORS LIST
LIST OF TOPICS
PRINT THIS ARTICLE
by Koos van der Merwe
When you see a gap occur on a price chart, it is likely that the gap will be filled at some point.
Position: Buy
Koos van der Merwe
Has been a technical analyst since 1969, and has worked as a futures and options trader with First Financial Futures in Johannesburg, South Africa.
PRINT THIS ARTICLE
GAPS
A Gap Waiting To Be Filled
06/06/14 05:35:06 PMby Koos van der Merwe
When you see a gap occur on a price chart, it is likely that the gap will be filled at some point.
Position: Buy
| Filling a gap is one of the concepts of stock market trading with technical analysis. Does that mean you should look for shares that have fallen on a gap, buy some, and then wait for the share price to rise and fill the gap before selling at a profit? One share where this strategy could be currently applied is Just Energy Group Inc. (JE.N). The share price has fallen dramatically on a gap over the past week, presenting a temptation to buy to fill the gap. As an aside, the company also pays an attractive yield. |

|
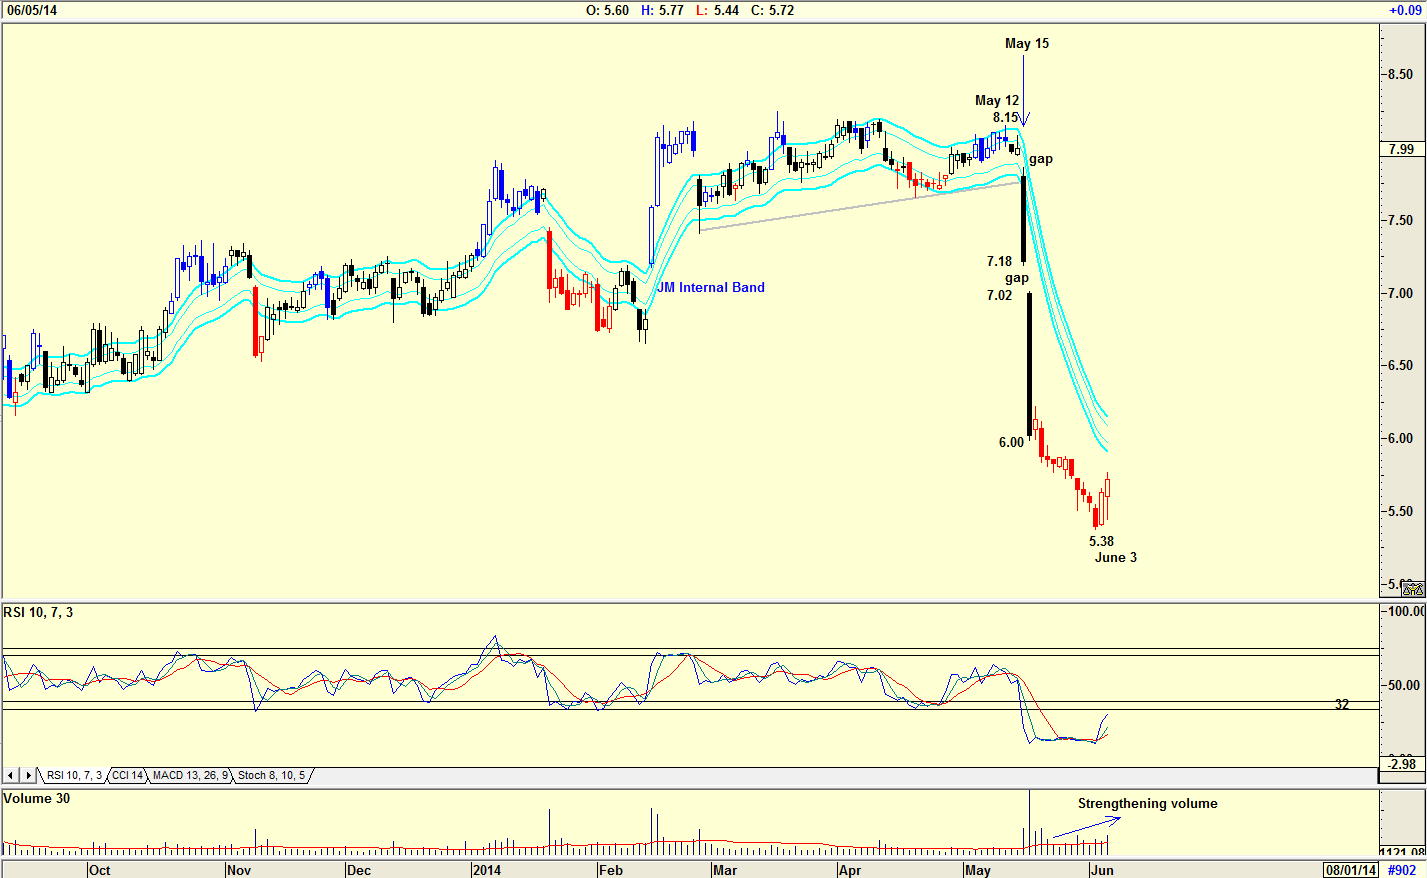
| Figure 1. Daily chart of Just Energy as listed on the US market, showing the gaps. |
| Graphic provided by: AdvancedGET. |
| |
| The chart in Figure 1 shows how the share price started a correction on May 12, 2014 from $8.15 and then falling on a gap to $7.18 and falling on a second gap on May 16, 2014 to $6.00. The share price then continued falling to a low of $5.38 by June 3, 2014 where it appears to have formed a bottom. The reason for the collapse in the share price is not for us to determine. As technical analysts, we look at the chart for guidance. The RSI indicator which has fallen well below the 32 horizontal level has not yet given a buy signal, a signal that will be triggered when the RSI indicator moves above the 32 level. Looking at the chart however, you can see that as the share price rose, volume strengthened — a positive signal. You could therefore expect the share price to rise to "fill the gap" at $7.02. Investors on the other hand, could wait for the share price to break above the upper band of the JM Internal Band before buying. The JM Internal Band is a 15-period simple moving average offset by 2% positive and 2% negative. A buy signal is given when the share price breaks above the upper band, and a sell signal is given when the share price falls below the lower band. |

|
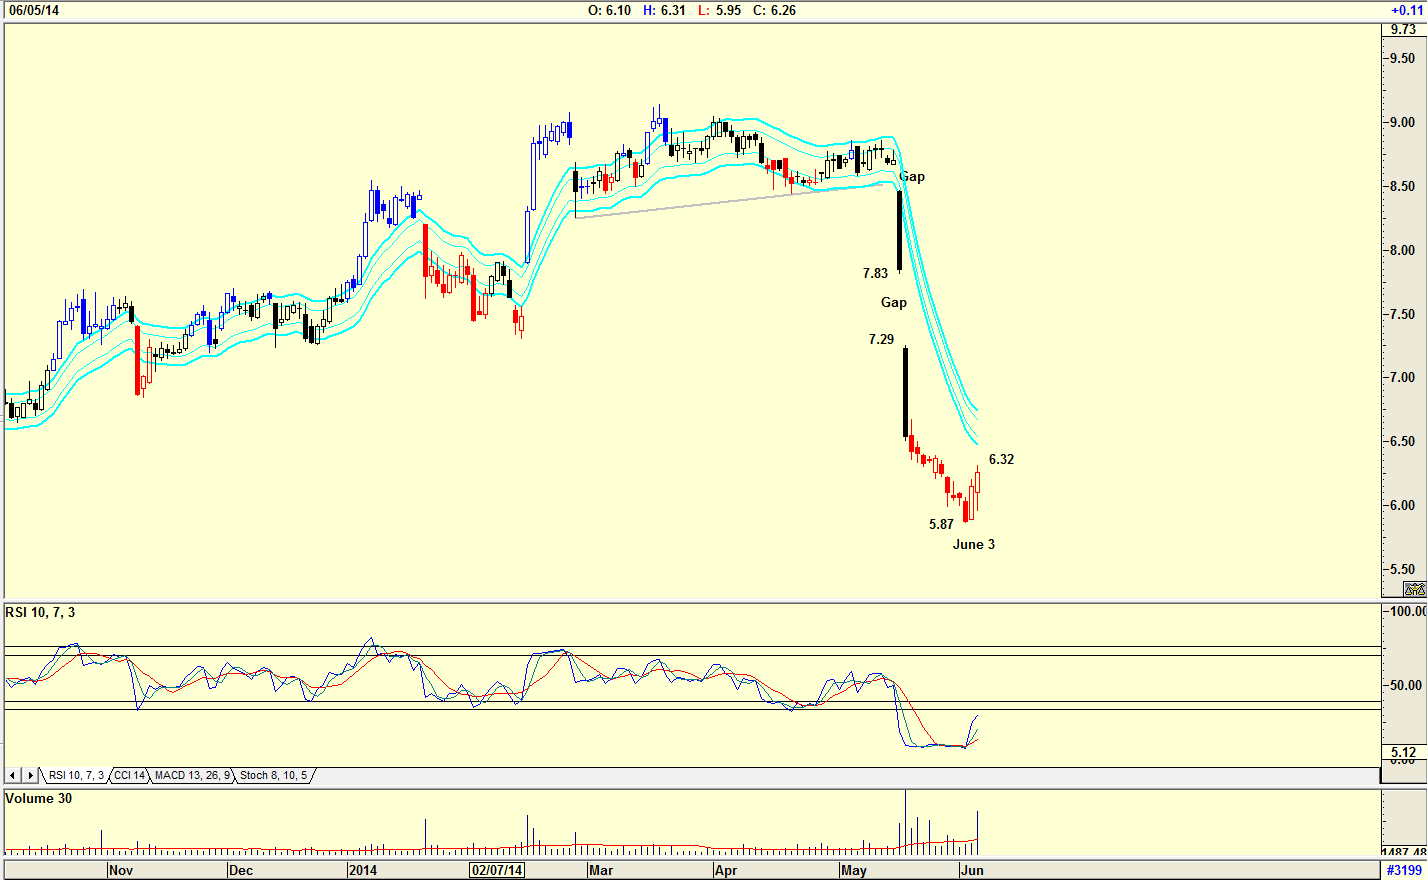
| Figure 2. Just Energy as listed on the TSX showing larger gaps. |
| Graphic provided by: AdvancedGET. |
| |
| The chart in Figure 2 is a daily chart of Just Energy as listed on the Toronto Stock Exchange. Note that the gaps are larger than those of the stock quoted on the US stock exchange. With the current price of $6.32, rising on strong volume, and an RSI approaching buy levels, it might be worth taking the risk and buying at the present price rather than wait for a JM Internal Band buy signal. Filling the gap is a strategy worth looking at — a strategy that can be profitable if played correctly. |
Has been a technical analyst since 1969, and has worked as a futures and options trader with First Financial Futures in Johannesburg, South Africa.
| Address: | 3256 West 24th Ave |
| Vancouver, BC | |
| Phone # for sales: | 6042634214 |
| E-mail address: | petroosp@gmail.com |
Click here for more information about our publications!
PRINT THIS ARTICLE

Request Information From Our Sponsors
- VectorVest, Inc.
- Executive Premier Workshop
- One-Day Options Course
- OptionsPro
- Retirement Income Workshop
- Sure-Fire Trading Systems (VectorVest, Inc.)
- Trading as a Business Workshop
- VectorVest 7 EOD
- VectorVest 7 RealTime/IntraDay
- VectorVest AutoTester
- VectorVest Educational Services
- VectorVest OnLine
- VectorVest Options Analyzer
- VectorVest ProGraphics v6.0
- VectorVest ProTrader 7
- VectorVest RealTime Derby Tool
- VectorVest Simulator
- VectorVest Variator
- VectorVest Watchdog
- StockCharts.com, Inc.
- Candle Patterns
- Candlestick Charting Explained
- Intermarket Technical Analysis
- John Murphy on Chart Analysis
- John Murphy's Chart Pattern Recognition
- John Murphy's Market Message
- MurphyExplainsMarketAnalysis-Intermarket Analysis
- MurphyExplainsMarketAnalysis-Visual Analysis
- StockCharts.com
- Technical Analysis of the Financial Markets
- The Visual Investor
