HOT TOPICS LIST
- MACD
- Fibonacci
- RSI
- Gann
- ADXR
- Stochastics
- Volume
- Triangles
- Futures
- Cycles
- Volatility
- ZIGZAG
- MESA
- Retracement
- Aroon
INDICATORS LIST
LIST OF TOPICS
PRINT THIS ARTICLE
by David Penn
How real is this countertrend rally? We've been here before ...
Position: N/A
David Penn
Technical Writer for Technical Analysis of STOCKS & COMMODITIES magazine, Working-Money.com, and Traders.com Advantage.
PRINT THIS ARTICLE
ELLIOTT WAVE
Third Waves: Then and Now
10/17/02 11:49:51 AMby David Penn
How real is this countertrend rally? We've been here before ...
Position: N/A
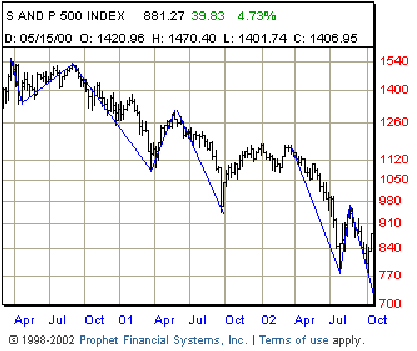
| There are interesting parallels between where we are now in the S&P 500 and where we were as investors in January 2001. Sure, the differences are legion: there was no war on terrorism, there was hardly a president of the United States--given the myriad uncertainties surrounding the election at the time. And there was hardly a bear market, with the S&P 500 down only 16%. At the time, of course, the S&P 500 was down slightly from the previous year (2000) and, given the annual returns in the previous years, a 16% loss was unusual, but nothing more than a healthy correction en route to Dow 36,000 and S&P who-knows-what. |
| But the prolonged slide of the bear market in stocks from September 2000 to March 2001 gave investors the first taste of what bear markets could be like. Not with a sharp collapse such as the Black Monday of 1987, but with something more akin to the slow-motion agony of drowning, the S&P 500 took suffering investors down week after week after week ... |

|
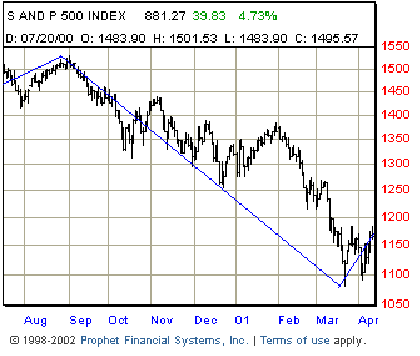
| Figure 1: The first intermediate third wave from September 2000 to March 2001 shaved over 360 points from the S&P 500. Will the second intermediate third wave beginning in August 2002 do the same? |
| Graphic provided by: Prophet.net. |
| |
| The mid-October 2002 rally in stocks has many already proclaiming the emergence of a double bottom and, if not new, all-time highs, then at least the kind of market rally upon which legions of even clueless investors could get fat. But we've seen such rallies in the midst of weeks of declines, the most exemplary of which would probably be the rally in stocks in January 2001, a four-week advance that took place right smack in the middle of the S&P 500's first major decline of the millennial bear market--a decline that turned into a 35-week cyclical bear. |
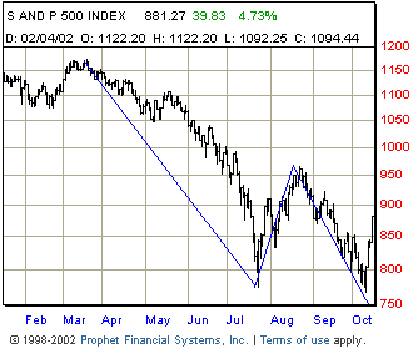
 Figure 2: The traditionally bullish "January Effect" in 2001 was another "last chance" for long-term investors to sell into strength. Remembering the January rally of 2001 is helpful as the markets rally explosively here in October 2002. For all the fury of the January 2001 rally, the S&P 500 only gained 150 points from its most recent correction low, and did not even take out the high of the previous month (December). Or the previous November. Or the previous August ...  Figure 3: The intermediate cycle bear market that began in August 2002 experiences a bullish upthrust in October. The four-day advance in mid-October 2002 has already taken out the October high at about 850, gaining about 110 points. The September highs at 925 and the August highs just above 950 loom as significant resistance. In fact, in order for the much-longed for S&P 500 double bottom to take place, an advance to 950 is a minimum--to say nothing of a successful double bottom that would theoretically take the S&P 500 to 1125 or higher. |
| It goes without saying that the S&P 500 still appears to be in a bear mode--both in terms of the "primary" downward movement that began in March 2002, as well as the "intermediate" downward swing that began in August 2002. In fact, I suspect the S&P 500 is also in a bearish mode on the "minor" level, as well, a view that anticipates a top in the four-day S&P 500 rally that began on October 10th. But most important is understanding how even a few bullish days in the context of a bear market can muddy the waters and confuse thinking. It's been a powerfully bullish four days. But we've been here before. |
Technical Writer for Technical Analysis of STOCKS & COMMODITIES magazine, Working-Money.com, and Traders.com Advantage.
| Title: | Technical Writer |
| Company: | Technical Analysis, Inc. |
| Address: | 4757 California Avenue SW |
| Seattle, WA 98116 | |
| Phone # for sales: | 206 938 0570 |
| Fax: | 206 938 1307 |
| Website: | www.Traders.com |
| E-mail address: | DPenn@traders.com |
Traders' Resource Links | |
| Charting the Stock Market: The Wyckoff Method -- Books | |
| Working-Money.com -- Online Trading Services | |
| Traders.com Advantage -- Online Trading Services | |
| Technical Analysis of Stocks & Commodities -- Publications and Newsletters | |
| Working Money, at Working-Money.com -- Publications and Newsletters | |
| Traders.com Advantage -- Publications and Newsletters | |
| Professional Traders Starter Kit -- Software | |
Click here for more information about our publications!
Comments
Date: 10/17/02Rank: 1Comment: How about this rally coming off a 4 year cycle bottom.So maybe the context for this rally is somewhat different and more sustainable.
Date: 10/18/02Rank: 5Comment: Excellent article. I d like see archives of other articles also by this author. A chart is worth more than thousand words and David s analysis of that is outstanding.
Date: 10/20/02Rank: 5Comment:
Date: 10/22/02Rank: 4Comment: Do you think were re getting close to a top in this bear market rally.
Date: 10/22/02Rank: 5Comment:

|

Request Information From Our Sponsors
- StockCharts.com, Inc.
- Candle Patterns
- Candlestick Charting Explained
- Intermarket Technical Analysis
- John Murphy on Chart Analysis
- John Murphy's Chart Pattern Recognition
- John Murphy's Market Message
- MurphyExplainsMarketAnalysis-Intermarket Analysis
- MurphyExplainsMarketAnalysis-Visual Analysis
- StockCharts.com
- Technical Analysis of the Financial Markets
- The Visual Investor
- VectorVest, Inc.
- Executive Premier Workshop
- One-Day Options Course
- OptionsPro
- Retirement Income Workshop
- Sure-Fire Trading Systems (VectorVest, Inc.)
- Trading as a Business Workshop
- VectorVest 7 EOD
- VectorVest 7 RealTime/IntraDay
- VectorVest AutoTester
- VectorVest Educational Services
- VectorVest OnLine
- VectorVest Options Analyzer
- VectorVest ProGraphics v6.0
- VectorVest ProTrader 7
- VectorVest RealTime Derby Tool
- VectorVest Simulator
- VectorVest Variator
- VectorVest Watchdog
