

HOT TOPICS LIST
- MACD
- Fibonacci
- RSI
- Gann
- ADXR
- Stochastics
- Volume
- Triangles
- Futures
- Cycles
- Volatility
- ZIGZAG
- MESA
- Retracement
- Aroon
INDICATORS LIST
LIST OF TOPICS
PRINT THIS ARTICLE
by Donald W. Pendergast, Jr.
Allergan Inc. shares prepare to push higher in a classic AB=CD Fibonacci swing pattern.
Position: N/A
Donald W. Pendergast, Jr.
Freelance financial markets writer and online publisher of the Trendzetterz.com S&P 500 Weekly Forecast service.
PRINT THIS ARTICLE
FIBONACCI
Allergan Inc. (AGN): Another Run At A New High
06/09/14 04:43:20 PMby Donald W. Pendergast, Jr.
Allergan Inc. shares prepare to push higher in a classic AB=CD Fibonacci swing pattern.
Position: N/A
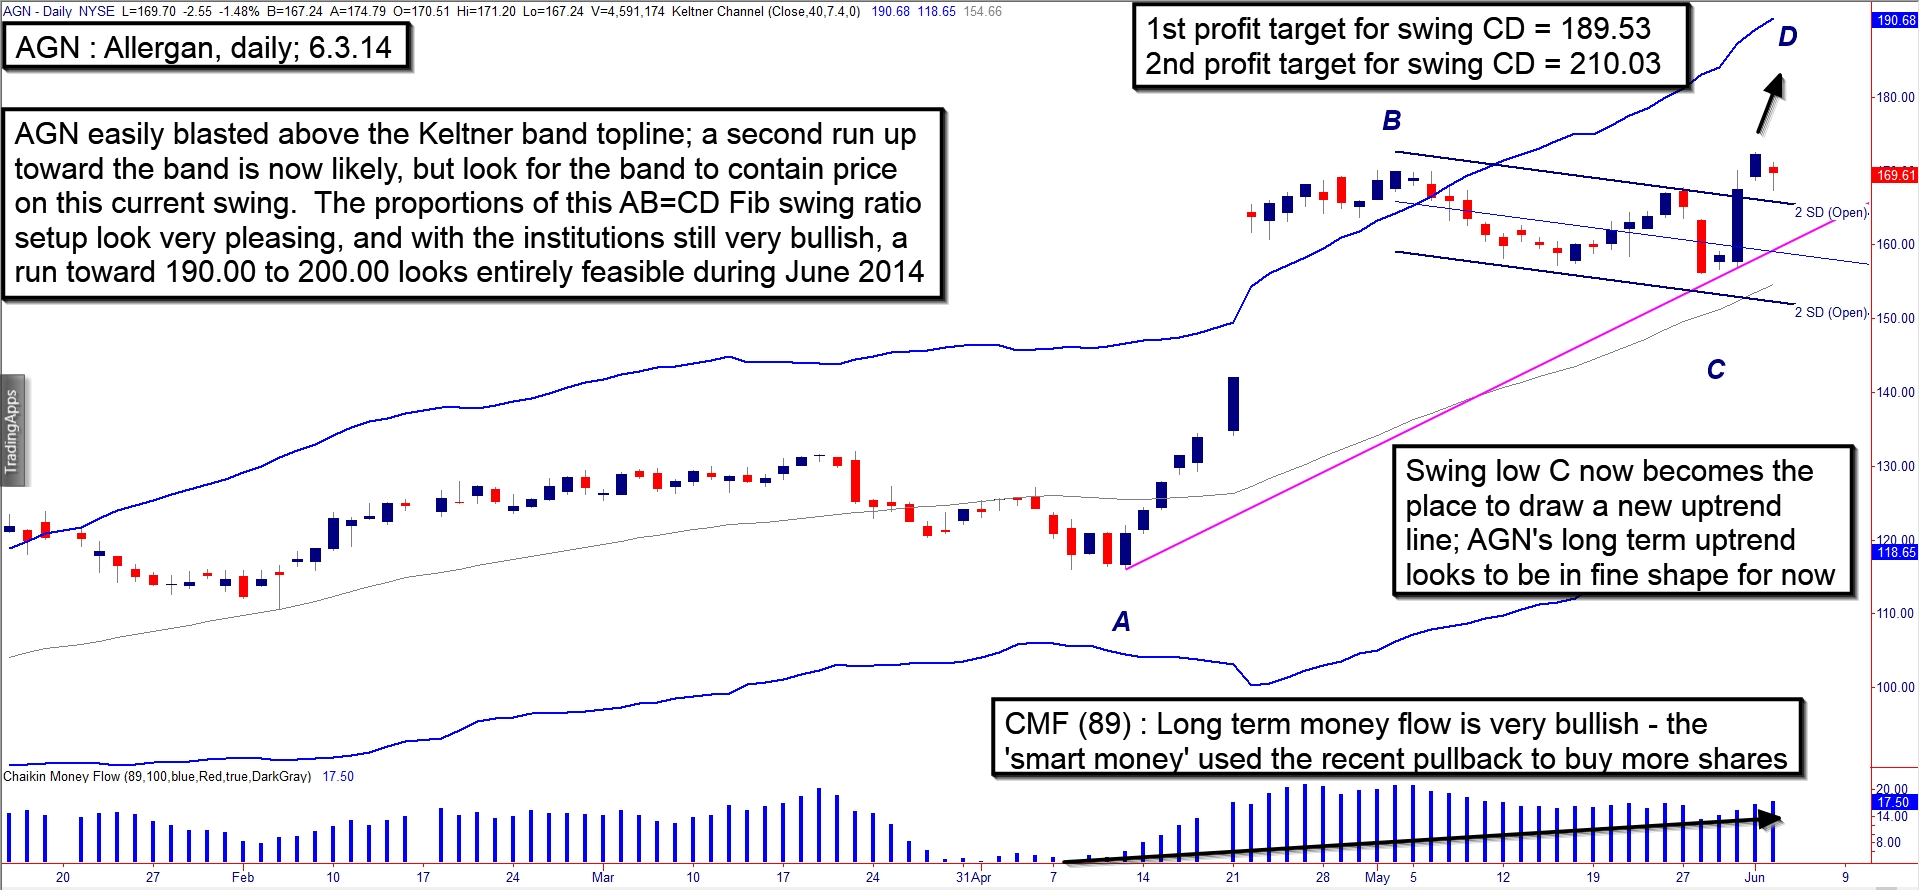
| In less than seven months, shares of Allergan Inc. (AGN) have jumped by more than 90% and still appear to have at least one more bullish swing to go before a major cycle high is in place. With the so-called "smart money" appearing to be all-in for yet another swing higher, June 2014 should see AGN run up toward the 190.00 area — at a minimum — unless the major stock indexes all decide to a take a major tumble soon. Here's a closer look at AGN's daily chart patterns (Figure 1). |
|
| Figure 1. Allergan Inc. (AGN): A wonderful AB=CD Fibonacci swing ratio pattern has now presented itself on AGN's daily chart. Note the clean bullish break from the linear regression channel as swing CD gets underway. |
| Graphic provided by: TradeStation. |
| |
| AGN's latest sustained rally launched out of the November 7, 2013 cycle low, one that occurred near the tail end of a significant (18 weeks) narrow-range, sideways price action. Since late 2013, AGN is up by more than 90% and still has a full slate of bullish technicals stacked in its favor, such as the following items: 1. The long-term Chaikin Money Flow histogram (CMF)(89) has been above its zero line since November 2013, and even more bullish is that the histogram hardly dropped during the proportional correction seen in the stock during May 2014. This is a sure-fire confirmation that the big institutions are still holding this stock in full expectation of even more gains. 2. A beautiful Fibonacci ratio swing pattern is now playing out, with the line of least resistance easily pointing to significant gains yet to be made in swing CD; if CD goes to .62 of the length of AB, the price target becomes 189.30, and if there is a full AB=CD, then CD should top out at/near/above 210.03. 3. Note the current relationship of price to the upper Keltner channel (set at 7.5 ATR's away from a 40-period average); AGN plowed through the upper band on its way to the May 2014 high, and now after a mild correction, the stock is well below the band. Often, the top band will act as a powerful resistance when a subsequent rally plays out — even if it manages to make a new high. These technical dynamics suggest the following: A. Institutional strength (strong long-term money flows) will continue to push AGN back up to even higher highs soon. B. The AB=CD Fib swing pattern should play out with swing CD moving higher by at least 62% if not 100% of the length of swing AB (which was good for 54 points). C. The Keltner band structure suggests that it should act as a powerful (temporary?) cap to swing CD, after which some sort of pullback/reversal might be expected. In some cases, however, price will touch the upper Keltner and then ascend right along with the slope of the band itself. If a major price cycle is now taking over this could also come to pass as the summer months play out. |
|
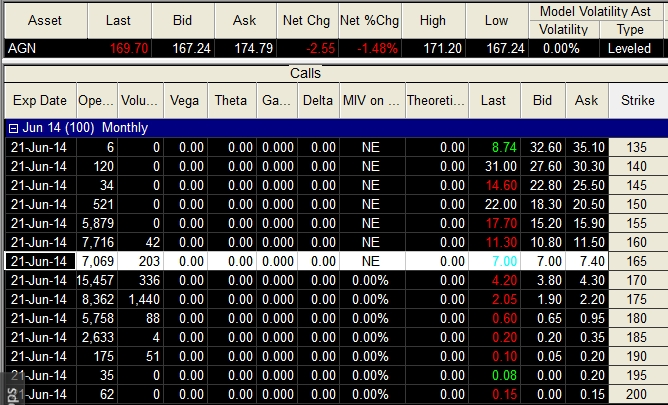
| Figure 2. AGN's June '14 $165.00 calls have strong open interest and daily trading volume. Bid-ask spreads are okay, but prepare to work a bid to get a better price if possible. |
| Graphic provided by: TradeStation. |
| Graphic provided by: TradeStation Option Analysis. |
| |
| Playing this emerging swing in AGN is simple enough: 1. Covered call traders may want to sell one June 2014 AGN $165.00 call for every 100 shares they acquire in the stock; look to hold the position through the June 21, 2014 expiration and use a 13-to 21-day exponential moving average as your trailing stop for the life of the trade. 2. Swing traders can go long on a break above 172.48, managing the trade with a three-bar trailing stop of the daily lows for the duration of the trade. If AGN approaches the 189.00 area before a stop out, consider booking at least half your gains as cheap profit protection insurance. Account risk should be limited to 2% or less; as always, remember to trade wisely until we meet here again. |
Freelance financial markets writer and online publisher of the Trendzetterz.com S&P 500 Weekly Forecast service.
| Title: | Market consultant and writer |
| Company: | Trendzetterz |
| Address: | 81 Hickory Hollow Drive |
| Crossville, TN 38555 | |
| Phone # for sales: | 904-303-4814 |
| Website: | trendzetterz.com |
| E-mail address: | support@trendzetterz.com |
Traders' Resource Links | |
| Trendzetterz has not added any product or service information to TRADERS' RESOURCE. | |
Click here for more information about our publications!
PRINT THIS ARTICLE

Request Information From Our Sponsors
- StockCharts.com, Inc.
- Candle Patterns
- Candlestick Charting Explained
- Intermarket Technical Analysis
- John Murphy on Chart Analysis
- John Murphy's Chart Pattern Recognition
- John Murphy's Market Message
- MurphyExplainsMarketAnalysis-Intermarket Analysis
- MurphyExplainsMarketAnalysis-Visual Analysis
- StockCharts.com
- Technical Analysis of the Financial Markets
- The Visual Investor
- VectorVest, Inc.
- Executive Premier Workshop
- One-Day Options Course
- OptionsPro
- Retirement Income Workshop
- Sure-Fire Trading Systems (VectorVest, Inc.)
- Trading as a Business Workshop
- VectorVest 7 EOD
- VectorVest 7 RealTime/IntraDay
- VectorVest AutoTester
- VectorVest Educational Services
- VectorVest OnLine
- VectorVest Options Analyzer
- VectorVest ProGraphics v6.0
- VectorVest ProTrader 7
- VectorVest RealTime Derby Tool
- VectorVest Simulator
- VectorVest Variator
- VectorVest Watchdog