

HOT TOPICS LIST
- MACD
- Fibonacci
- RSI
- Gann
- ADXR
- Stochastics
- Volume
- Triangles
- Futures
- Cycles
- Volatility
- ZIGZAG
- MESA
- Retracement
- Aroon
INDICATORS LIST
LIST OF TOPICS
PRINT THIS ARTICLE
by Matt Blackman
Stock indexes can't continue to soar higher without the support of an increasing number of new highs in stocks. But how will breadth tell you when the music is about to stop?
Position: N/A
Matt Blackman
Matt Blackman is a full-time technical and financial writer and trader. He produces corporate and financial newsletters, and assists clients in getting published in the mainstream media. He is the host of TradeSystemGuru.com. Matt has earned the Chartered Market Technician (CMT) designation. Find out what stocks and futures Matt is watching on Twitter at www.twitter.com/RatioTrade
PRINT THIS ARTICLE
DIVERGENCE INDEX
Market Breadth - Divergence Key In Picking The Next Top
06/03/14 04:10:52 PMby Matt Blackman
Stock indexes can't continue to soar higher without the support of an increasing number of new highs in stocks. But how will breadth tell you when the music is about to stop?
Position: N/A
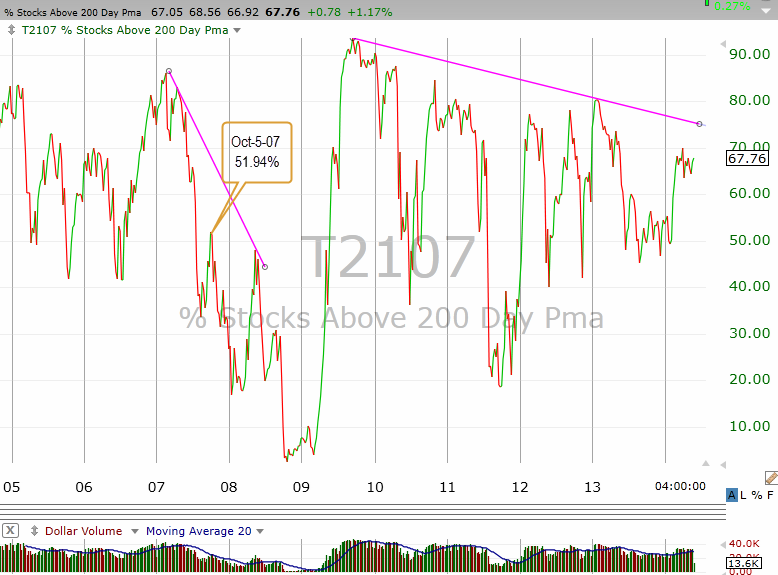
| In late February 2007, the percentage of stocks trading above their 200-day moving averages (T2107) was an impressive 86%. But then came March and this number started to drop as did the S&P 500 (SPX). However, even after stock prices recovered to new highs, T2107 began a rather steep decline putting in a series of lower lows and lower highs. By early August, the T2107 was trading just above 30% after the SPX dropped from 1550 to 1430. But then as before, the SPX managed to soar to a new high of 1561.80 on October 12, 2007. However, the percentage of stocks trading above their 200-day moving average (MA) only managed to climb to 52%, well off the high that occurred eight months earlier. Exactly one year later, the SPX had fallen by more than 40%. |
|
| Figure 1 � Weekly chart of the percentage of stocks trading above their 200-day moving average (MA) showing how they have negatively diverged with the S&P 500 index before and since 2009. |
| Graphic provided by: TC2000.com. |
| |
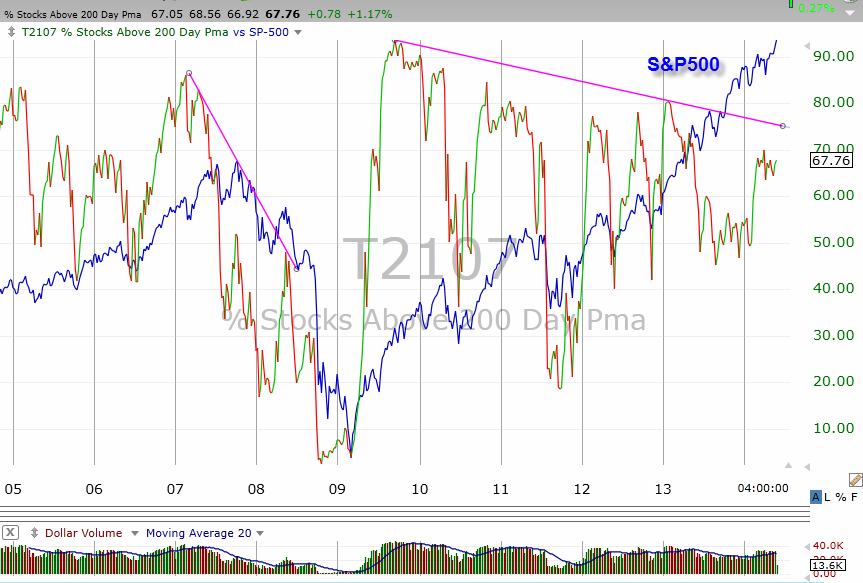
| In Figure 2 you see the T2107 and S&P 500 (blue) plotted together showing how they have interacted both then and now. On September 18, 2009 the T2107 put in a high of nearly 94%. The SPX was trading at 1068. And as Figure 2 shows, the percentage of stocks above their 200-day MA has continually diverged lower ever since, putting in a series of lower highs with the latest peak of 69% occurring in early April 2014. Despite this, the SPX has continued to power higher. |
|
| Figure 2 � Weekly chart of the percentage of stocks trading above their 200-day MA with the S&P 500 index (blue) showing the interplay between the two and the much more gradual divergence since 2009. |
| Graphic provided by: TC2000.com. |
| |
| As Samuel Clements once said, "History may not repeat itself but it does rhyme at lot." One of the biggest mistakes traders can make it to continue to fight the last war — to wait for the exact conditions that led to the last correction. It is well understood that conditions can never be exactly the same again — the challenge that most get wrong each time around is in seeing the rhyme. |
| For example, in 2007, central banks around the globe had yet to discover the quantitative easing Pandora's Box. That certainly isn't true now. Each time investors get ready to throw in the towel as we see by the series of T2107 tops over the last five years, the money has appeared to drive the next rally. That alone has dramatically changed the trading and investing stage. |
| We won't know when the next peak has been put in for certain but one major clue will be a rapid deterioration in market breadth as evidenced by a much lower T2107 peak to coincide with the next top in the S&P 500 index. Some believe that that peak is already at hand. Unfortunately for them, the SPX hasn't been ready to listen! |
Matt Blackman is a full-time technical and financial writer and trader. He produces corporate and financial newsletters, and assists clients in getting published in the mainstream media. He is the host of TradeSystemGuru.com. Matt has earned the Chartered Market Technician (CMT) designation. Find out what stocks and futures Matt is watching on Twitter at www.twitter.com/RatioTrade
| Company: | TradeSystemGuru.com |
| Address: | Box 2589 |
| Garibaldi Highlands, BC Canada | |
| Phone # for sales: | 604-898-9069 |
| Fax: | 604-898-9069 |
| Website: | www.tradesystemguru.com |
| E-mail address: | indextradermb@gmail.com |
Traders' Resource Links | |
| TradeSystemGuru.com has not added any product or service information to TRADERS' RESOURCE. | |
Click here for more information about our publications!
PRINT THIS ARTICLE

Request Information From Our Sponsors
- StockCharts.com, Inc.
- Candle Patterns
- Candlestick Charting Explained
- Intermarket Technical Analysis
- John Murphy on Chart Analysis
- John Murphy's Chart Pattern Recognition
- John Murphy's Market Message
- MurphyExplainsMarketAnalysis-Intermarket Analysis
- MurphyExplainsMarketAnalysis-Visual Analysis
- StockCharts.com
- Technical Analysis of the Financial Markets
- The Visual Investor
- VectorVest, Inc.
- Executive Premier Workshop
- One-Day Options Course
- OptionsPro
- Retirement Income Workshop
- Sure-Fire Trading Systems (VectorVest, Inc.)
- Trading as a Business Workshop
- VectorVest 7 EOD
- VectorVest 7 RealTime/IntraDay
- VectorVest AutoTester
- VectorVest Educational Services
- VectorVest OnLine
- VectorVest Options Analyzer
- VectorVest ProGraphics v6.0
- VectorVest ProTrader 7
- VectorVest RealTime Derby Tool
- VectorVest Simulator
- VectorVest Variator
- VectorVest Watchdog