HOT TOPICS LIST
- MACD
- Fibonacci
- RSI
- Gann
- ADXR
- Stochastics
- Volume
- Triangles
- Futures
- Cycles
- Volatility
- ZIGZAG
- MESA
- Retracement
- Aroon
INDICATORS LIST
LIST OF TOPICS
PRINT THIS ARTICLE
by Koos van der Merwe
With natural gas being discovered in abundance, is it worth looking at?
Position: Buy
Koos van der Merwe
Has been a technical analyst since 1969, and has worked as a futures and options trader with First Financial Futures in Johannesburg, South Africa.
PRINT THIS ARTICLE
TECHNICAL ANALYSIS
NYSE Arca Mini-Natural Gas
06/04/14 04:21:37 PMby Koos van der Merwe
With natural gas being discovered in abundance, is it worth looking at?
Position: Buy
| Natural Gas is becoming the major energy source throughout the world, starting to replace oil. With new sources being discovered yearly, the latest being off Israel and Cyprus, countries are becoming independent in their energy needs, no longer looking to Saudi Arabia or Iran for their oil needs. Comparing the NYSE Arca Natural Gas Index to the price of gold shows how natural gas share prices are slowly rising. |

|
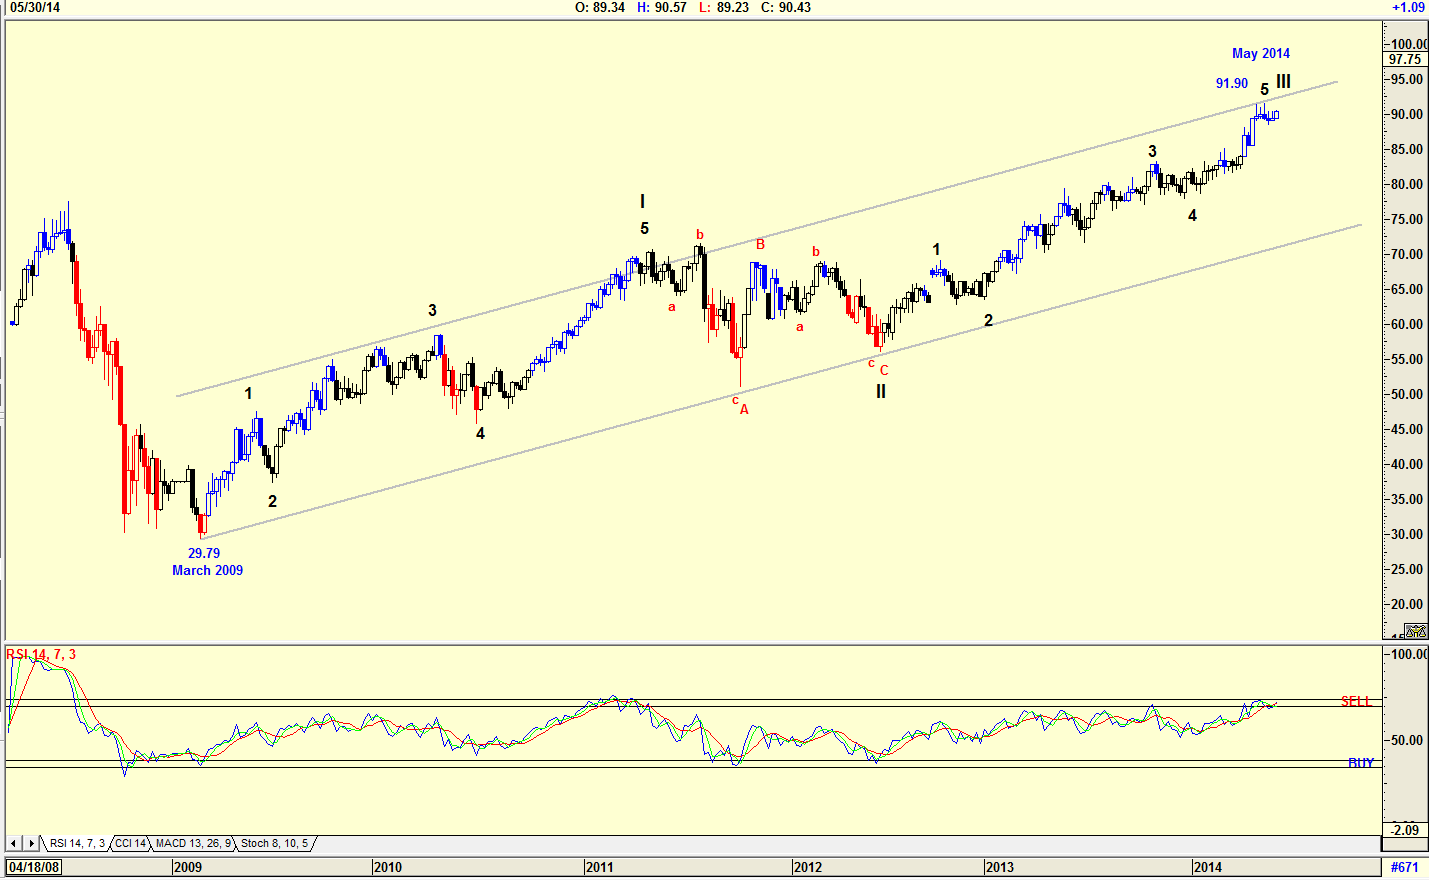
| Figure 1. Weekly chart with Elliott wave count. |
| Graphic provided by: AdvancedGET. |
| |
| The chart in Figure 1 is a weekly chart and shows how the share price has risen from a low of $29.79 in March 2009 to a high of $91.90 by May 2014. The share price is testing the upper resistance line and the RSI indicator is suggesting a sell signal, so you should expect the share price to correct down. An Elliott wave count is also suggesting that the share price should correct in a WAVE IV. |

|
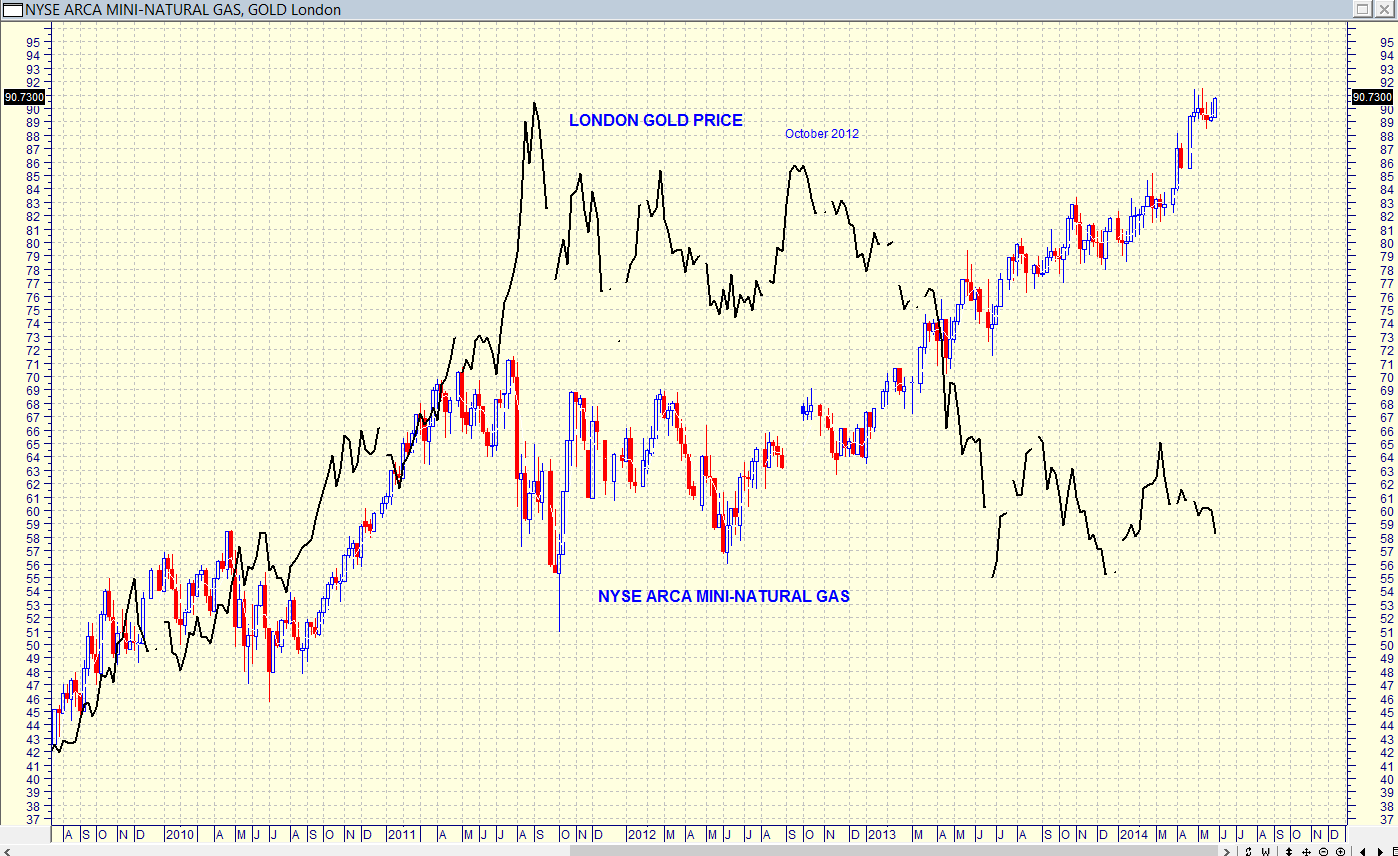
| Figure 2. Weekly chart with London gold price overlaid. |
| Graphic provided by: MetaStock. |
| |
| The chart in Figure 2 is a weekly chart of the NYSE Arca Mini Natural Gas with the London gold price overlaid. You can see how the share price of the index tracked the London gold price until November 2012 when the price rose to new highs as the London gold price fell. |

|
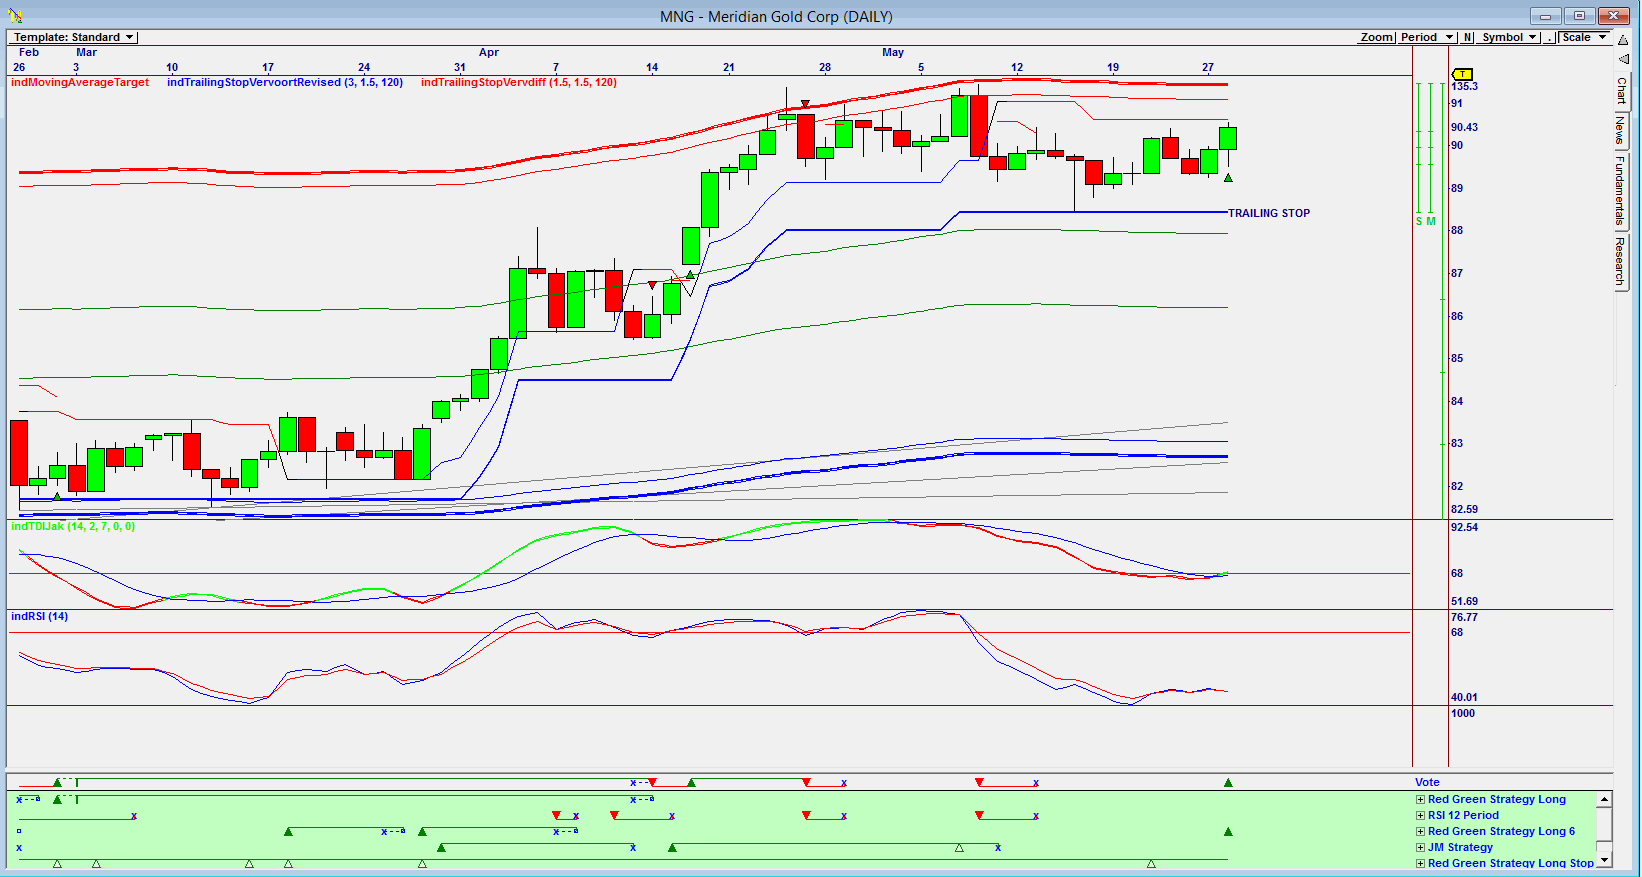
| Figure 3. Daily chart with VOTE line suggesting a buy. |
| Graphic provided by: Omnitrader.. |
| |
| The chart in Figure 3 is the Omnitrader chart that brought the share to my attention. The chart is showing a buy signal given on the VOTE line based on the strategy, Red Green Long 6 shown in green below the VOTE line. Note that the Red Green Strategy Long Stop has been long since the start of the chart. With the share price close to the upper external band, I would be a buyer of the share, but would have my stops close. Do note that the TDIJAK indicator has also given a buy signal. Although the Omnitrader chart has suggested a buy, I would be a buyer at the price of $94.43. However, because the share price is close to the upper external band, it could be preferable to wait for a correction before buying. This is based on the negativity of the weekly chart in Figure 1. Short-term traders could buy at the current price, but long-term investors should wait for that correction. |
Has been a technical analyst since 1969, and has worked as a futures and options trader with First Financial Futures in Johannesburg, South Africa.
| Address: | 3256 West 24th Ave |
| Vancouver, BC | |
| Phone # for sales: | 6042634214 |
| E-mail address: | petroosp@gmail.com |
Click here for more information about our publications!
PRINT THIS ARTICLE

Request Information From Our Sponsors
- StockCharts.com, Inc.
- Candle Patterns
- Candlestick Charting Explained
- Intermarket Technical Analysis
- John Murphy on Chart Analysis
- John Murphy's Chart Pattern Recognition
- John Murphy's Market Message
- MurphyExplainsMarketAnalysis-Intermarket Analysis
- MurphyExplainsMarketAnalysis-Visual Analysis
- StockCharts.com
- Technical Analysis of the Financial Markets
- The Visual Investor
- VectorVest, Inc.
- Executive Premier Workshop
- One-Day Options Course
- OptionsPro
- Retirement Income Workshop
- Sure-Fire Trading Systems (VectorVest, Inc.)
- Trading as a Business Workshop
- VectorVest 7 EOD
- VectorVest 7 RealTime/IntraDay
- VectorVest AutoTester
- VectorVest Educational Services
- VectorVest OnLine
- VectorVest Options Analyzer
- VectorVest ProGraphics v6.0
- VectorVest ProTrader 7
- VectorVest RealTime Derby Tool
- VectorVest Simulator
- VectorVest Variator
- VectorVest Watchdog
