HOT TOPICS LIST
- MACD
- Fibonacci
- RSI
- Gann
- ADXR
- Stochastics
- Volume
- Triangles
- Futures
- Cycles
- Volatility
- ZIGZAG
- MESA
- Retracement
- Aroon
INDICATORS LIST
LIST OF TOPICS
PRINT THIS ARTICLE
by Gary Grosschadl
Even bearish formations are tradeable as this weekly chart shows via a descending triangle.
Position: N/A
Gary Grosschadl
Independent Canadian equities trader and technical analyst based in Peterborough
Ontario, Canada.
PRINT THIS ARTICLE
DESCENDING TRIANGLES
Trading Opportunities in Triangles
10/15/02 10:39:34 AMby Gary Grosschadl
Even bearish formations are tradeable as this weekly chart shows via a descending triangle.
Position: N/A
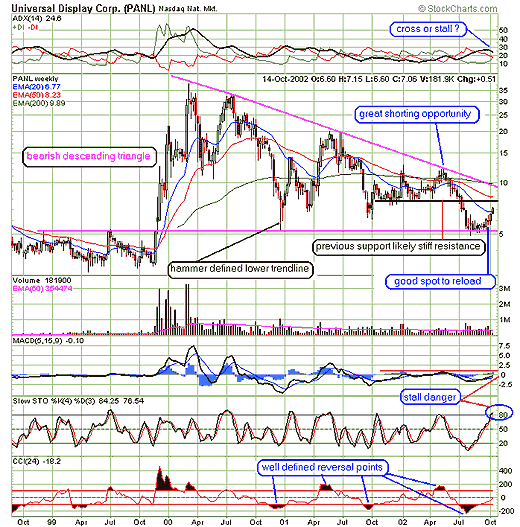
| Universal Display Corp. has been a volatile trader since its big breakout move in late 1999. Now you can see a multi-year pattern in the form of a bearish descending triangle. Those that spotted this pattern had the opportunity to make two exceptional trades - a short in early summer and a recent long position three weeks ago, as shown on chart. |
| The shorting opportunity came at the upper trendline touch where the candlesticks were dubious with their long upper shadows (tails) while short-term stochastics and longer term CCI (commodity channel index) both flashed overbought signals. The patient shorter was handsomely rewarded with a short at $10 and a cover around $5 over 10 weeks. |

|
| Graphic provided by: stockcharts.com. |
| |
| The next good opportunity came a few weeks ago for traders looking to go long. The stock did a basing period for two months and observant traders would have noted that the previous big hammer candle from late 2000 marked a good lower trendline. Also note how the short-term MACD indicator did show a bullish divergence (it did not set a new low with the stock price), hinting at a coming upleg. |
| So where do we stand now? It's likely too dangerous to go long now (unless you are very aggressive and switch to a daily chart) as it looks like a stall zone is approaching. Note the very high stochastic indicator and the resistance level marked near the $8 level (previous support likely future resistance). |
| The more prudent action would be to wait for the reversal that may very soon materialize forcing the stock back down to the $5 zone. Since this is a bearish formation, traders should also watch for any eventual weakness below $5 as this could attract shorters and you may be able to profit with them. The lesson here is that large triangle formations are very tradeable even from a weekly perspective. |
Independent Canadian equities trader and technical analyst based in Peterborough
Ontario, Canada.
| Website: | www.whatsonsale.ca/financial.html |
| E-mail address: | gwg7@sympatico.ca |
Click here for more information about our publications!
Comments
Date: 10/15/02Rank: 4Comment:
Date: 10/16/02Rank: 1Comment:
Date: 10/19/02Rank: 5Comment: i like the article.
Date: 10/22/02Rank: 5Comment:
Date: 10/22/02Rank: 5Comment:

Request Information From Our Sponsors
- StockCharts.com, Inc.
- Candle Patterns
- Candlestick Charting Explained
- Intermarket Technical Analysis
- John Murphy on Chart Analysis
- John Murphy's Chart Pattern Recognition
- John Murphy's Market Message
- MurphyExplainsMarketAnalysis-Intermarket Analysis
- MurphyExplainsMarketAnalysis-Visual Analysis
- StockCharts.com
- Technical Analysis of the Financial Markets
- The Visual Investor
- VectorVest, Inc.
- Executive Premier Workshop
- One-Day Options Course
- OptionsPro
- Retirement Income Workshop
- Sure-Fire Trading Systems (VectorVest, Inc.)
- Trading as a Business Workshop
- VectorVest 7 EOD
- VectorVest 7 RealTime/IntraDay
- VectorVest AutoTester
- VectorVest Educational Services
- VectorVest OnLine
- VectorVest Options Analyzer
- VectorVest ProGraphics v6.0
- VectorVest ProTrader 7
- VectorVest RealTime Derby Tool
- VectorVest Simulator
- VectorVest Variator
- VectorVest Watchdog
