HOT TOPICS LIST
- MACD
- Fibonacci
- RSI
- Gann
- ADXR
- Stochastics
- Volume
- Triangles
- Futures
- Cycles
- Volatility
- ZIGZAG
- MESA
- Retracement
- Aroon
INDICATORS LIST
LIST OF TOPICS
PRINT THIS ARTICLE
by Koos van der Merwe
Is there an alternative to the phrase "when in doubt, get out?"
Position: Sell
Koos van der Merwe
Has been a technical analyst since 1969, and has worked as a futures and options trader with First Financial Futures in Johannesburg, South Africa.
PRINT THIS ARTICLE
ELLIOTT WAVE
When In Doubt
06/03/14 04:06:18 PMby Koos van der Merwe
Is there an alternative to the phrase "when in doubt, get out?"
Position: Sell
| An investor should always look to buy stocks when everyone else is selling, and to sell stocks when everyone is buying. Joe Kennedy, father of the late US President John F. Kennedy, boasted that he went to cash ahead of the US depression of 1920-21 when the young boy who polished his shoes told him what shares he should buy. So, with so many bears currently calling for a depression, and one well known bear now changing his mind and calling for a bull market, should you start moving into cash? Or, is there an alternative, especially if you are a retiree and need a monthly cash income. If this is the case you should look at Real Estate Income Trusts (REITS). Admittedly, the interest they pay averaging 2.5% is not that attractive, but as long as the percentage paid is greater than the inflation rate, they are worth looking at. The other advantage is growth as more and more retirees look to these shares for comfort. One such share to look at is Federal Realty Investment Trust (FRT). |

|
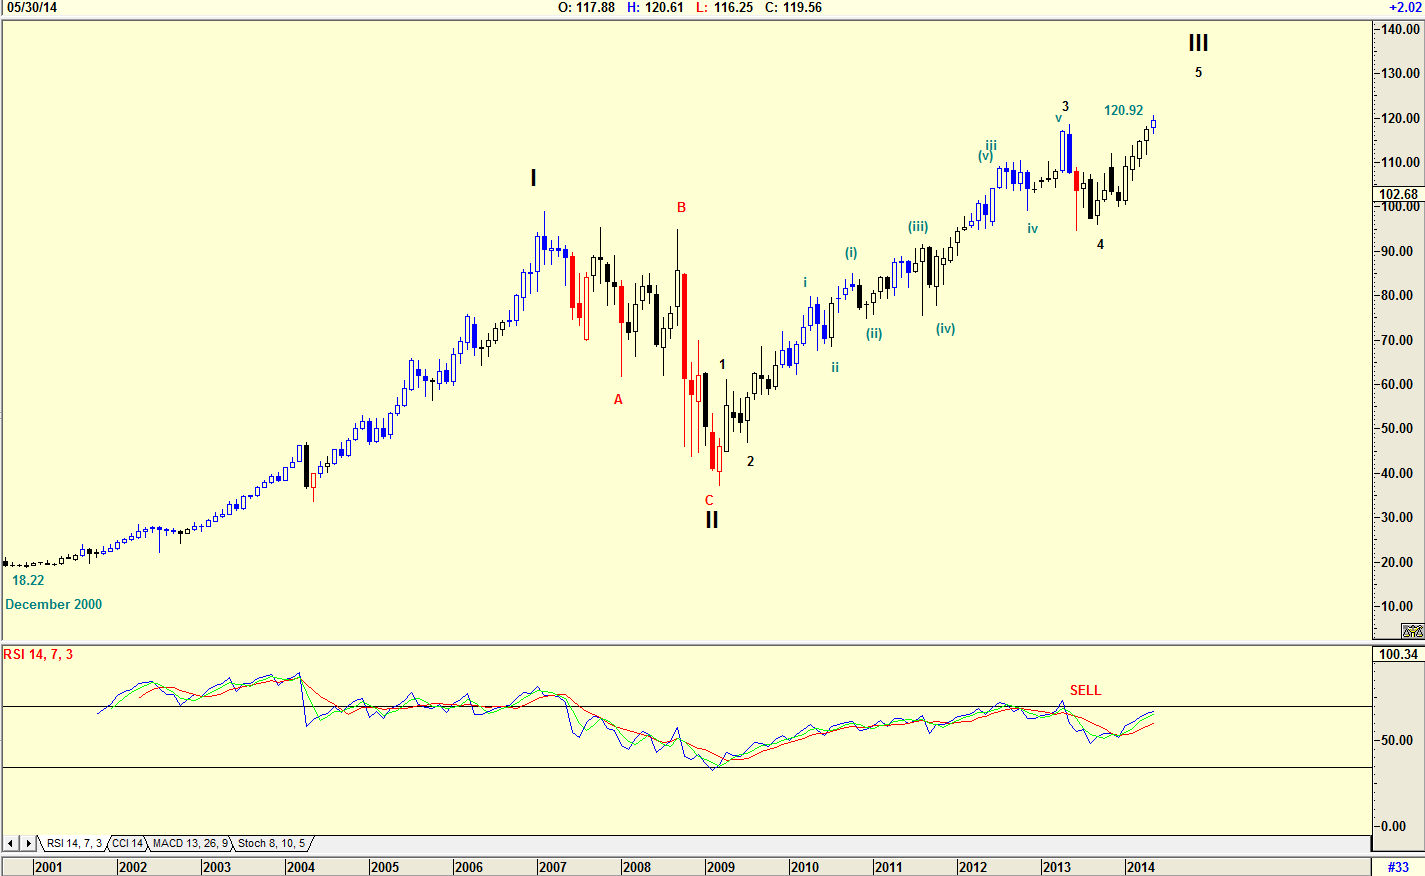
| Figure 1. Monthly chart with Elliott wave count. |
| Graphic provided by: AdvancedGET. |
| |
| The chart in Figure 1 is a monthly chart of FRT showing how the price rose from a low of $18.22 in December 2000 to its present high of $120.92. The Elliott wave count is suggesting that the share price is possibly completing a Wave 5 of WAVE III. This is supported by the RSI indicator which has moved from an overbought level giving a sell signal and suggesting a divergence sell signal may follow. |

|
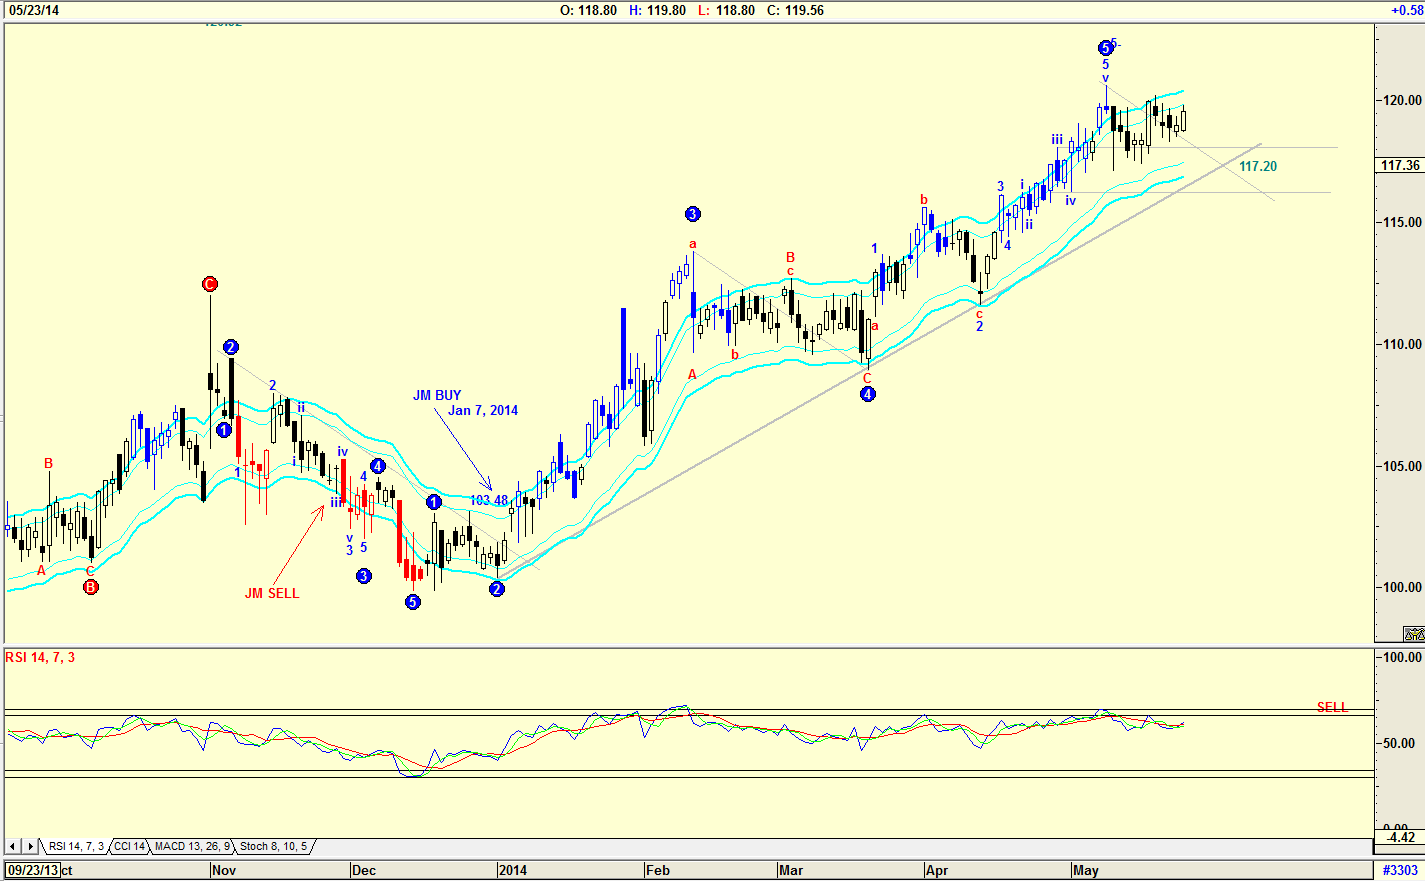
| Figure 2. Daily chart with Elliott wave count suggesting a correction. |
| Graphic provided by: AdvancedGET. |
| |
| The chart in Figure 2 is a daily chart with an Elliott wave count suggesting that a WAVE 5 is complete and that the share price should correct to approximately $117.20, the 4th Wave of lesser degree. The JM Internal Band gave a buy signal on January 7, 2014 when the share price was $103.48. A JM Internal Band is a 15-period simple moving average offset by 2% positive and 2% negative. A move above the upper band suggests a buy, and a move below the lower band a sell. With a present yield of 2.6% at a share priced at $119.99, the share is attractive as a buy on a correction. Investing in an REIT can be an attractive option when in doubt as to market direction or as security in a retirement portfolio. |
Has been a technical analyst since 1969, and has worked as a futures and options trader with First Financial Futures in Johannesburg, South Africa.
| Address: | 3256 West 24th Ave |
| Vancouver, BC | |
| Phone # for sales: | 6042634214 |
| E-mail address: | petroosp@gmail.com |
Click here for more information about our publications!
PRINT THIS ARTICLE

Request Information From Our Sponsors
- StockCharts.com, Inc.
- Candle Patterns
- Candlestick Charting Explained
- Intermarket Technical Analysis
- John Murphy on Chart Analysis
- John Murphy's Chart Pattern Recognition
- John Murphy's Market Message
- MurphyExplainsMarketAnalysis-Intermarket Analysis
- MurphyExplainsMarketAnalysis-Visual Analysis
- StockCharts.com
- Technical Analysis of the Financial Markets
- The Visual Investor
- VectorVest, Inc.
- Executive Premier Workshop
- One-Day Options Course
- OptionsPro
- Retirement Income Workshop
- Sure-Fire Trading Systems (VectorVest, Inc.)
- Trading as a Business Workshop
- VectorVest 7 EOD
- VectorVest 7 RealTime/IntraDay
- VectorVest AutoTester
- VectorVest Educational Services
- VectorVest OnLine
- VectorVest Options Analyzer
- VectorVest ProGraphics v6.0
- VectorVest ProTrader 7
- VectorVest RealTime Derby Tool
- VectorVest Simulator
- VectorVest Variator
- VectorVest Watchdog
