

HOT TOPICS LIST
- MACD
- Fibonacci
- RSI
- Gann
- ADXR
- Stochastics
- Volume
- Triangles
- Futures
- Cycles
- Volatility
- ZIGZAG
- MESA
- Retracement
- Aroon
INDICATORS LIST
LIST OF TOPICS
PRINT THIS ARTICLE
by Donald W. Pendergast, Jr.
Shares of Tesla Motors have experienced two significant corrections since October 2013; the latest one may be nearing its end, with a tradable rally soon to appear.
Position: N/A
Donald W. Pendergast, Jr.
Freelance financial markets writer and online publisher of the Trendzetterz.com S&P 500 Weekly Forecast service.
PRINT THIS ARTICLE
FIBONACCI
TSLA: Prepping For A Rebound?
05/30/14 05:48:32 PMby Donald W. Pendergast, Jr.
Shares of Tesla Motors have experienced two significant corrections since October 2013; the latest one may be nearing its end, with a tradable rally soon to appear.
Position: N/A
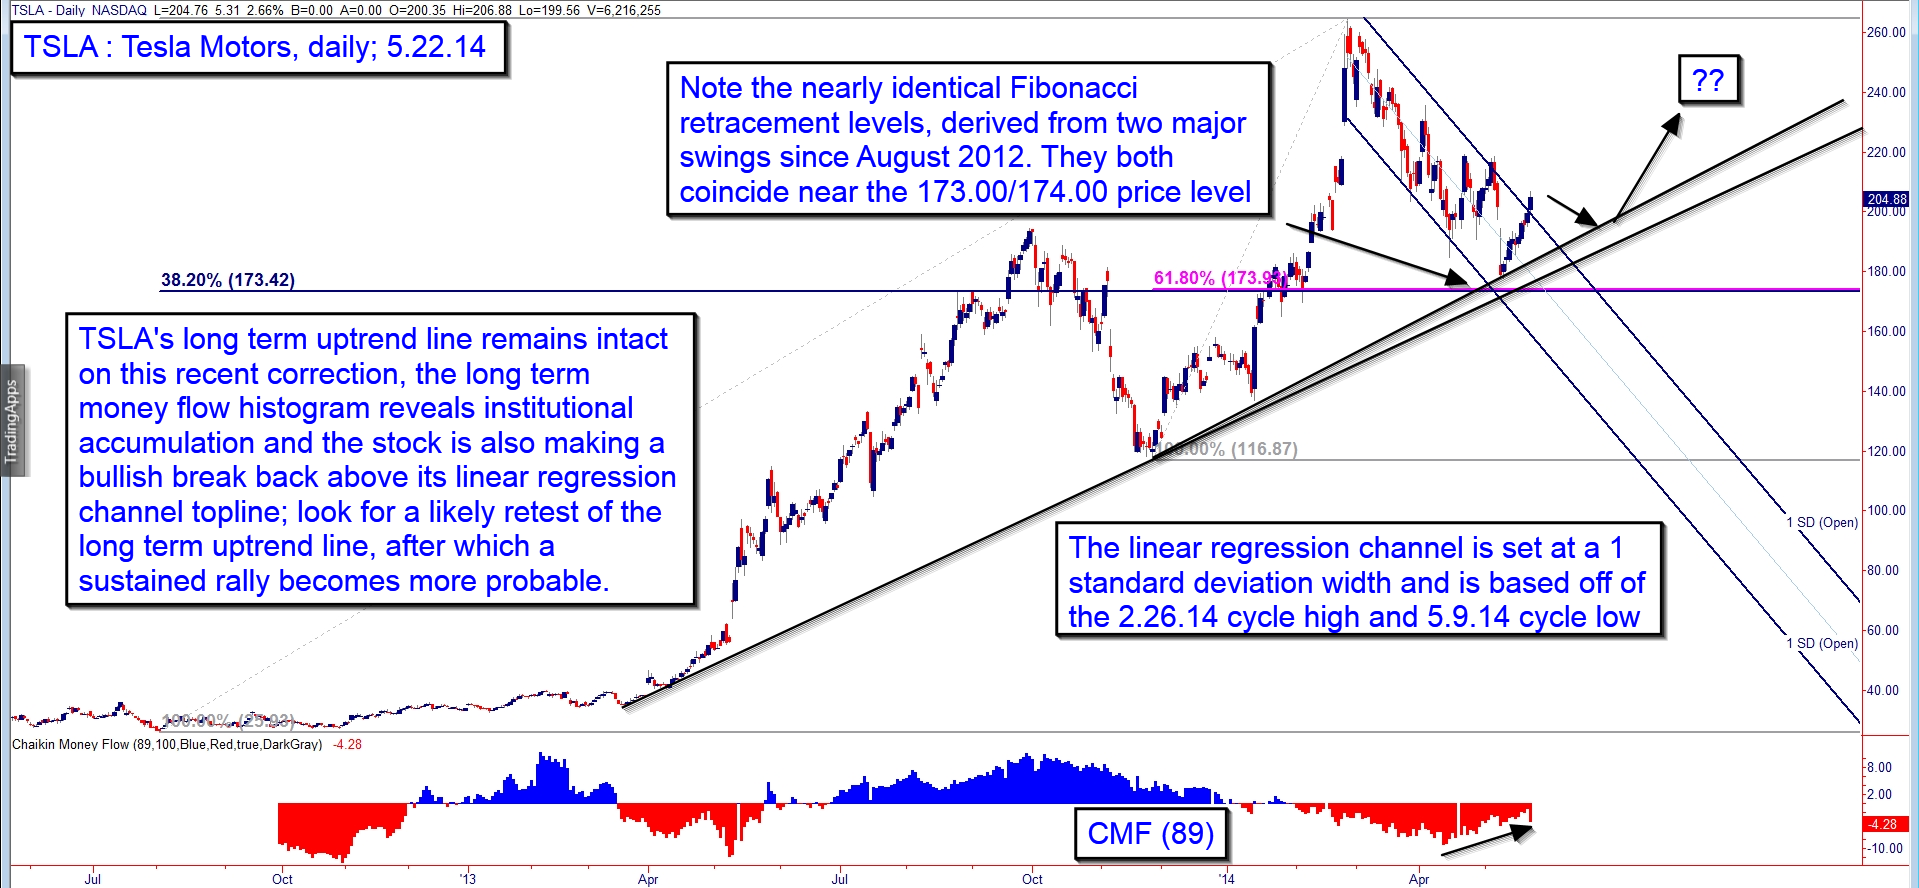
| It's always exciting to see the stock of an up and coming company begin to accelerate higher as the big institutional traders start building substantial long-term positions in it; there has been plenty of excitement since the last quarter of 2012 as Tesla Motors Inc.(TSLA) ramped up from the mid-$20s and then soared to 194.50 one year later. A two month long correction ensued, but the big money players were just waiting to get another piece of the action. They once again ran TSLA up — this time from 116.10 to 265.00 between mid-November 2013 and late February 2014. As these two massive upswings played out, a lovely long-term uptrend line could be plotted, one that gave (and still gives) some advance warning of where the stock will likely find major support on future pullbacks. Make no mistake, TSLA is in a major bull trend and the technicals are stacking up on its daily chart in such a way as to suggest that the stock is already prepping for its next tradable upswing. Here's why the current chart dynamics suggest a strong rally soon: 1. Major uptrend line is intact. 2. Long-term Chaikin Money Flow (CMF)(89) reveals accumulation by institutions on the last part of the recent correction. 3. The combined 38%/62% Fibonacci retracement support level near 173.00/174.00 and the uptrend lines have done an excellent job of identifying – beforehand – the bullish bounce we now see in TSLA. 4. Finally, note the nascent bullish breakout above the topline of the linear regression channel; the stock may be a bit overbought at the moment, so expect another pullback to the uptrend line, after which a sustainable rally has a high probability of appearing. |
|
| Figure 1. Tesla Motors Inc. (TSLA); a major uptrend line, twin Fibonacci support levels, successful support test, signs of institutional accumulation, and a linear regression channel breakout all suggest that the line of least resistance for this stock is toward higher prices. |
| Graphic provided by: TradeStation. |
| |
| There is no real secret trading/investing formula involved here, and you can use these basic trend ID/support/resistance principles to help you evaluate any kind of liquid, large cap stock or ETF before putting on a trade. A. Determine the long-term trend, using trend lines and price swings to confirm the dominant direction. B. Watch for signs of institutional accumulation/distribution. C. Look for regression channel breakouts going in the direction of the dominant price trend and money flow trend, particularly if such a breakout occurs near a major support/resistance level. D. Always check the long-term fundamentals, too, particularly if trading off of weekly and monthly charts. |
|
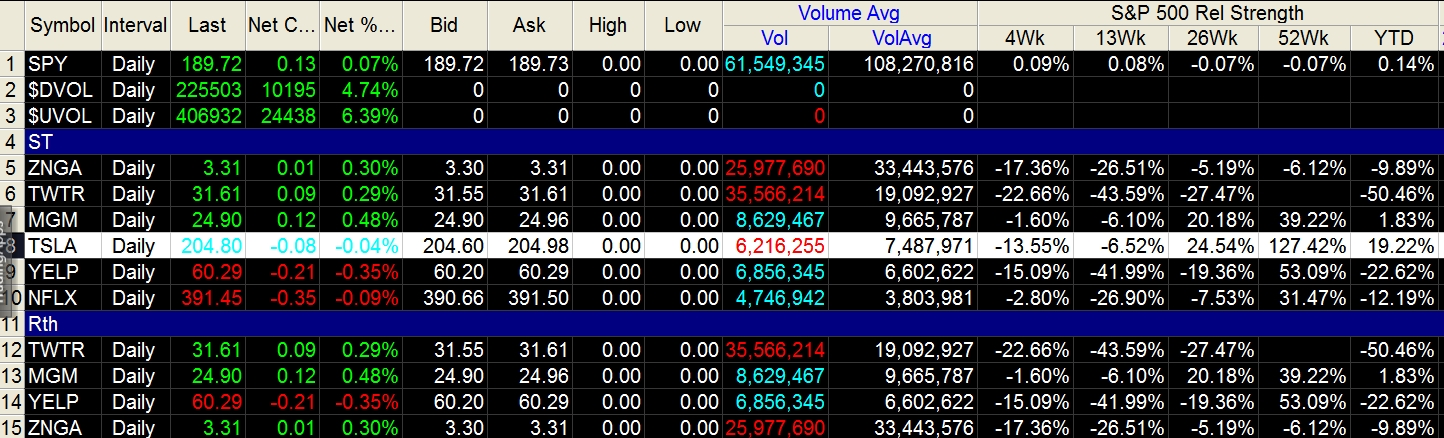
| Figure 2. TSLA is still outperforming the S&P 500 index (.SPX) year-to-date, but is severely underperforming over the past 4- and 13-week periods. |
| Graphic provided by: TradeStation. |
| Graphic provided by: TradeStation RadarScreen. |
| |
| Playing TSLA on the long side is straightforward: 1. Sell near-term puts on any further upside, using the June 2014 $175 ones; these have a good bid/ask spread and fantastic liquidity. You have major support barriers between the current price of the stock ($204.00) and the $175.00 strike, and that's the big idea here — it's really a no-brainer, low risk premium selling option play. 2. Wait for a pullback toward the major uptrend line and then buy the stock on subsequent strength. Manage the trade with a three-bar trail of the daily lows. That's really about it; TSLA looks to be on the verge of a decent swing move higher, the trend is up, supports have easily held and the line of least resistance looks to be higher. Keep your account trade risk at 2% or less and give this setup a shot, especially if you have knack for selling puts, as this looks like the lowest-risk put sale I've seen in some time. Trade wisely until we meet here again. |
Freelance financial markets writer and online publisher of the Trendzetterz.com S&P 500 Weekly Forecast service.
| Title: | Market consultant and writer |
| Company: | Trendzetterz |
| Address: | 81 Hickory Hollow Drive |
| Crossville, TN 38555 | |
| Phone # for sales: | 904-303-4814 |
| Website: | trendzetterz.com |
| E-mail address: | support@trendzetterz.com |
Traders' Resource Links | |
| Trendzetterz has not added any product or service information to TRADERS' RESOURCE. | |
Click here for more information about our publications!
Comments

Request Information From Our Sponsors
- StockCharts.com, Inc.
- Candle Patterns
- Candlestick Charting Explained
- Intermarket Technical Analysis
- John Murphy on Chart Analysis
- John Murphy's Chart Pattern Recognition
- John Murphy's Market Message
- MurphyExplainsMarketAnalysis-Intermarket Analysis
- MurphyExplainsMarketAnalysis-Visual Analysis
- StockCharts.com
- Technical Analysis of the Financial Markets
- The Visual Investor
- VectorVest, Inc.
- Executive Premier Workshop
- One-Day Options Course
- OptionsPro
- Retirement Income Workshop
- Sure-Fire Trading Systems (VectorVest, Inc.)
- Trading as a Business Workshop
- VectorVest 7 EOD
- VectorVest 7 RealTime/IntraDay
- VectorVest AutoTester
- VectorVest Educational Services
- VectorVest OnLine
- VectorVest Options Analyzer
- VectorVest ProGraphics v6.0
- VectorVest ProTrader 7
- VectorVest RealTime Derby Tool
- VectorVest Simulator
- VectorVest Variator
- VectorVest Watchdog