

HOT TOPICS LIST
- MACD
- Fibonacci
- RSI
- Gann
- ADXR
- Stochastics
- Volume
- Triangles
- Futures
- Cycles
- Volatility
- ZIGZAG
- MESA
- Retracement
- Aroon
INDICATORS LIST
LIST OF TOPICS
PRINT THIS ARTICLE
by Billy Williams
AXDX is not a popular stock, but that might change soon as it begins to outperform the market.
Position: Buy
Billy Williams
Billy Williams has been trading the markets for 27 years, specializing in momentum trading with stocks and options.
PRINT THIS ARTICLE
STOCKS
AXDX Trending Higher
05/30/14 05:41:37 PMby Billy Williams
AXDX is not a popular stock, but that might change soon as it begins to outperform the market.
Position: Buy
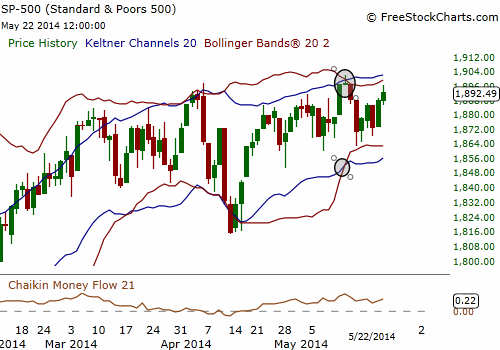
| Accelerate Diagnotics Inc. (AXDX) has undergone a transformation from a penny stock to an emerging stock that has been in a bull run for almost two years now. The stock hasn't warranted much attention from investors, especially the major institutions, but AXDX's price action is exhibiting some compelling technical criteria that may be a force to be reckoned with and beginning to attract a following. Steady trends complemented by steady accumulation are a few of the clues that signal that AXDX may explode higher to outperform the market. The market as a whole is trading in a tight range which has led to a squeeze setup that indicates a big price move may be underway (Figure 1). A squeeze setup is in effect when the Bollinger Bands trade within the Keltner Channels, revealing that volatility is contracting which is usually followed by an expansion where price explodes in a given direction. |
|
| Figure 1. The SPX has a squeeze setup taking place where the Bollinger Bands are trading within its Keltner Channels. The market is ready to explode higher if it stays in line with its current trend. |
| Graphic provided by: www.freestockcharts.com. |
| |
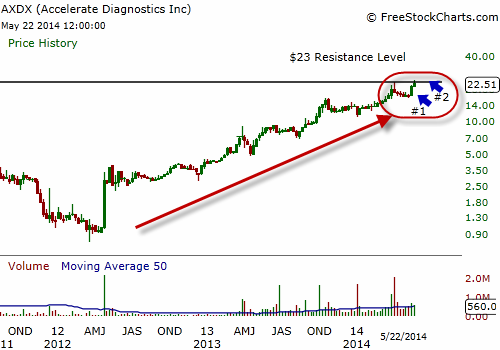
| The SPX is trading above its 200-day moving average and at an all-time price high, both of which are bullish indicators. This is important because 80% of stocks tend to follow the price movement of the overall market and with the SPX and other major indexes firmly in the bull's territory it puts the odds on the side of more upward movement for stocks as a whole. The same applies to AXDX which has come off a major run-up in price well above its 200-day simple moving average (SMA) while also trading at an all-time high (Figure 2). The On-Balance Volume indicator shows that the stock has been gathering support as the OBV line crossed above its 50-day SMA showing that AXDX is under accumulation. The bullish run in the stock's price action seems to be leading the SPX and the rest of the market which could mean the stock is emerging as a future stock leader. More than that, the stock is leading the market's price action and could signal an early entry as well as reveal a bullish move before a similar move shows up in the rest of the market. |
|
| Figure 2. AXDX bottomed in late 2012 and since then has been on a strong bull run. Its weekly chart shows a clear trend to the upside and appears ready to trade higher ahead of the overall market. |
| Graphic provided by: www.freestockcharts.com. |
| |
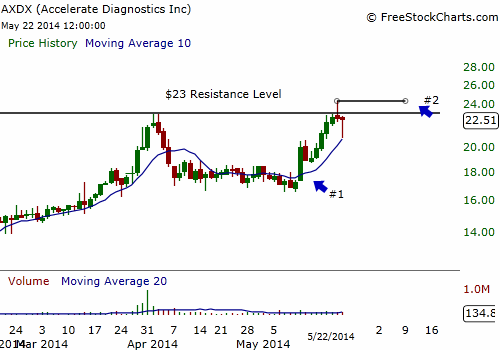
| AXDX peaked in early April around $23 before pulling back into a brief correction where it quickly found support before resuming an upward trend (Figure 3). The stock signaled an entry on May 12, 2014 where price closed over its 10-day SMA on greater volume than the previous 10 trading days. The stock quickly traded back to the $23 price level, almost a 17% gain, before encountering resistance and trailing back from its intraday high. The volume was not enough to signal a breakout entry but the stock may be worth watching for the next several days. If price continues to trade near its current high, then the bulls are likely to take the stock higher and you should wait for the price to trade above $24.30 before making an entry. |
|
| Figure 3. At point #1 a pivot entry was signaled and pushed the stock higher on strong volume but the stock has faltered at the $23 resistance level. Another entry could be signaled if the stock trades beyond the intraday high set at point #2. |
| Graphic provided by: www.freestockcharts.com. |
| |
| Still, keep in mind that AXDX is a volatile small-cap stock that can move quickly in either direction, so always play defensively. The rewards can be tremendous but the risks are greater too so you have to adapt your strategy to compensate for the added risk. |
Billy Williams has been trading the markets for 27 years, specializing in momentum trading with stocks and options.
| Company: | StockOptionSystem.com |
| E-mail address: | stockoptionsystem.com@gmail.com |
Traders' Resource Links | |
| StockOptionSystem.com has not added any product or service information to TRADERS' RESOURCE. | |
Click here for more information about our publications!
PRINT THIS ARTICLE

Request Information From Our Sponsors
- StockCharts.com, Inc.
- Candle Patterns
- Candlestick Charting Explained
- Intermarket Technical Analysis
- John Murphy on Chart Analysis
- John Murphy's Chart Pattern Recognition
- John Murphy's Market Message
- MurphyExplainsMarketAnalysis-Intermarket Analysis
- MurphyExplainsMarketAnalysis-Visual Analysis
- StockCharts.com
- Technical Analysis of the Financial Markets
- The Visual Investor
- VectorVest, Inc.
- Executive Premier Workshop
- One-Day Options Course
- OptionsPro
- Retirement Income Workshop
- Sure-Fire Trading Systems (VectorVest, Inc.)
- Trading as a Business Workshop
- VectorVest 7 EOD
- VectorVest 7 RealTime/IntraDay
- VectorVest AutoTester
- VectorVest Educational Services
- VectorVest OnLine
- VectorVest Options Analyzer
- VectorVest ProGraphics v6.0
- VectorVest ProTrader 7
- VectorVest RealTime Derby Tool
- VectorVest Simulator
- VectorVest Variator
- VectorVest Watchdog