HOT TOPICS LIST
- MACD
- Fibonacci
- RSI
- Gann
- ADXR
- Stochastics
- Volume
- Triangles
- Futures
- Cycles
- Volatility
- ZIGZAG
- MESA
- Retracement
- Aroon
INDICATORS LIST
LIST OF TOPICS
PRINT THIS ARTICLE
by Koos van der Merwe
Here's a look at what the charts are telling us.
Position: Buy
Koos van der Merwe
Has been a technical analyst since 1969, and has worked as a futures and options trader with First Financial Futures in Johannesburg, South Africa.
PRINT THIS ARTICLE
HEAD & SHOULDERS
Is JC Penny A Buy?
05/22/14 04:08:37 PMby Koos van der Merwe
Here's a look at what the charts are telling us.
Position: Buy
| When the stock market is in a correction, looking for what to buy is a challenge. A well-known analyst who appears on financial media channel CNBC liked JC Penny (JCP) and recommended it as a buy. Let's first take a look at some of the fundamentals. In 2011, JCP hired Ron Johnson as CEO. Johnson had helped build the successful Apple store. The move was a failure, and sales dropped alarmingly. As specialty retailers and on-line stores like Amazon.com are becoming today's vogue, mall department stores are slowly dying. Under its present CEO, Mike Ullman, the company has succeeded in erasing the ill-fated strategy of Ron Johnson. To date Ullman has succeeded in stabilizing the company and keeping it out of bankruptcy. However, the company still has a long way to go before it catches up to its competitors. Its biggest problem is simply staying alive. What do the technicals say? |

|
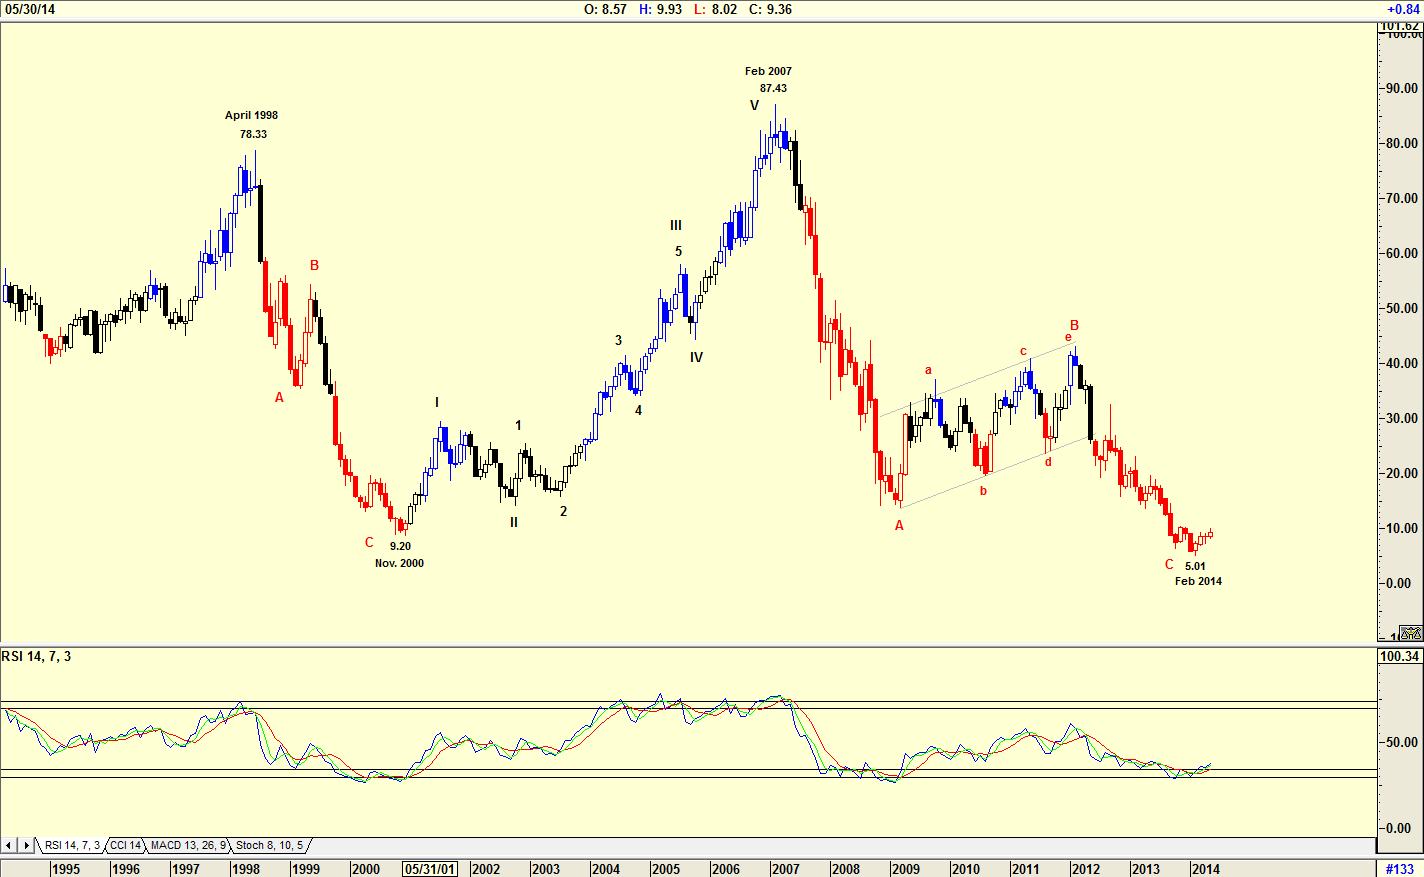
| Figure 1. Monthly chart suggesting a bottom. |
| Graphic provided by: AdvancedGET. |
| |
| The chart in Figure 1 is a monthly chart that shows how JCP fell from a high of $78.33 in April 1998 to a low of $9.20 by November 2000. Remarkably enough, this was before the technology bubble burst in 2000. This can be seen in the monthly chart of JCP in Figure 2, which has the S&P 500 index overlaid on it. |

|
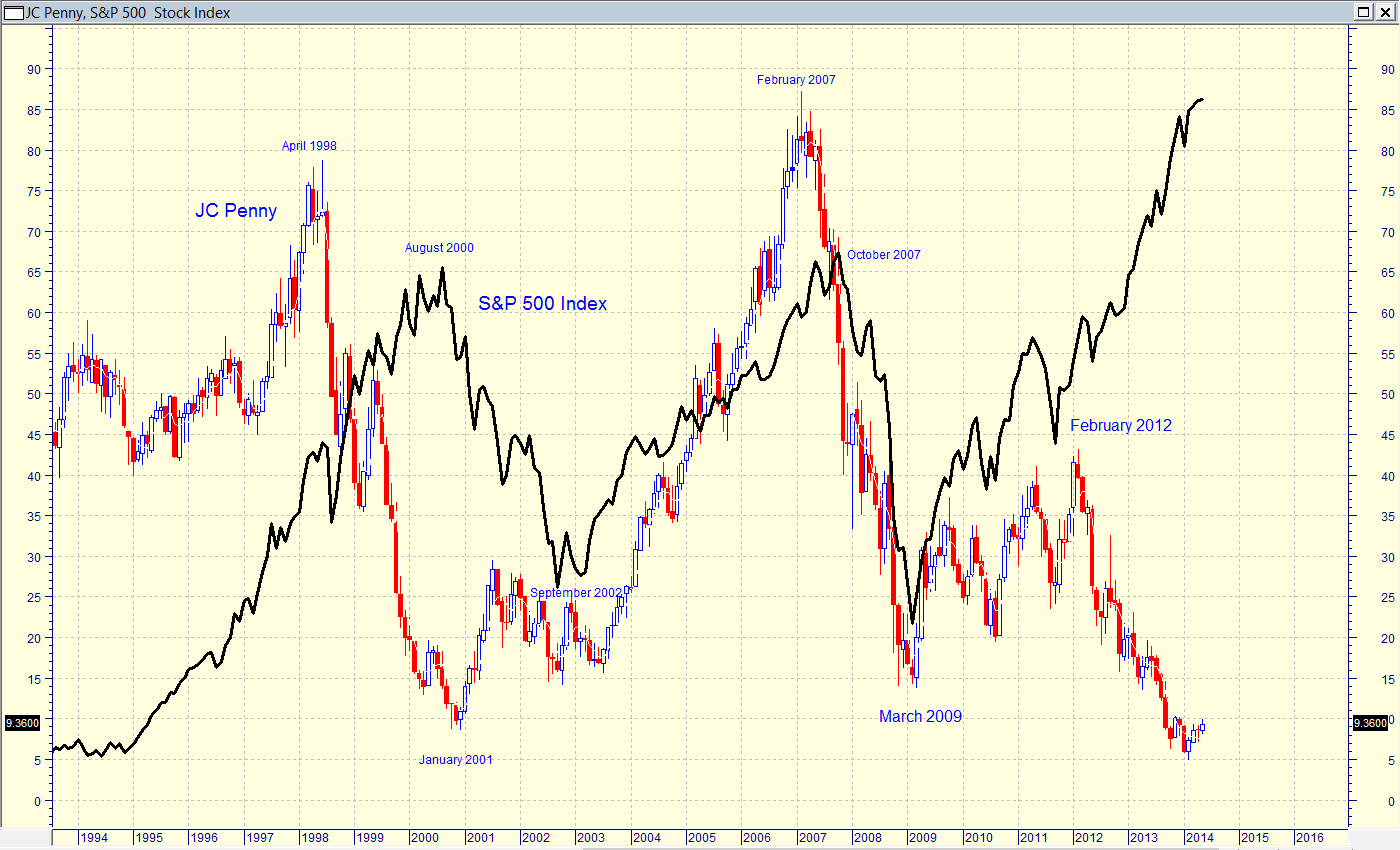
| Figure 2. Monthly chart with S&P500 index. |
| Graphic provided by: MetaStock. |
| |
| In the Figure 2 chart, note how the share price fell in April 1998, two years ahead of the fall of the S&P 500 index in August 2000. The share price recovered in January 2001 where the S&P 500 index only started recovering in September 2002. In February the share price topped and started falling, once again anticipating the October correction of the S&P 500 index. However, the share price recovered with the index in March 2009. In February 2012 where the index continued rising, the share price of JCP collapsed to today's low. |

|
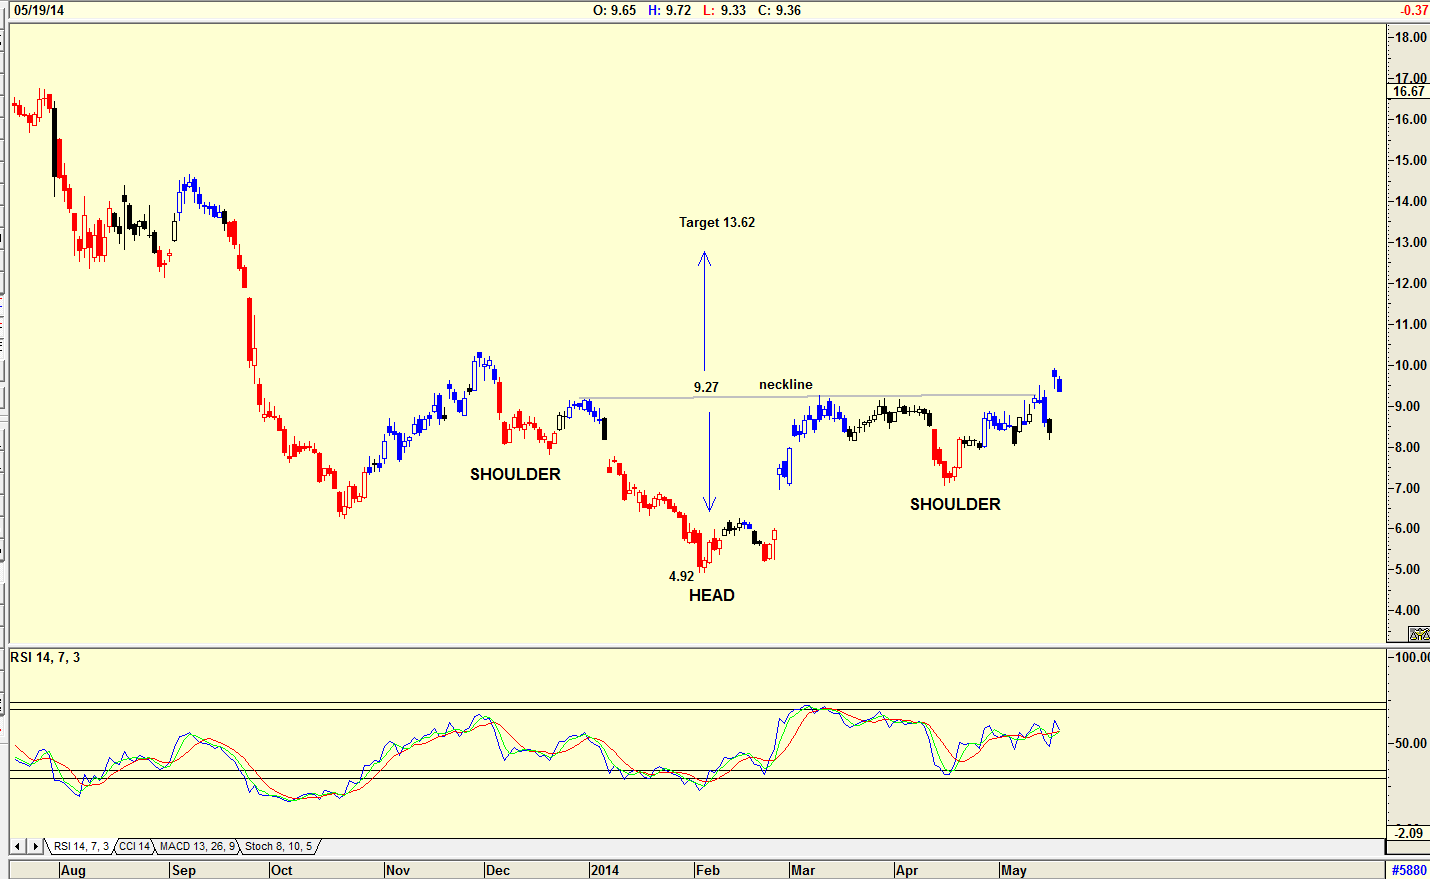
| Figure 3. Daily chart with inverse H&S pattern. |
| Graphic provided by: AdvancedGET. |
| |
| The daily chart of JCP in Figure 3 suggests an inverse head & shoulders (H&S) pattern with a target of $13.62. The share price has broken above the neckline, suggesting that the target could well be reached. The RSI indicator shown is also trending upward. JCP has two factors going for it — change of upper management and an inverse H&S pattern. Yes, the change in management and the return of the company to its original "selling" strategy within the store should see the share price improve, but as the inverse H&S pattern suggests, the upside could be limited. I would be a buyer of the share at the present price but I would keep my stops close. |
Has been a technical analyst since 1969, and has worked as a futures and options trader with First Financial Futures in Johannesburg, South Africa.
| Address: | 3256 West 24th Ave |
| Vancouver, BC | |
| Phone # for sales: | 6042634214 |
| E-mail address: | petroosp@gmail.com |
Click here for more information about our publications!
PRINT THIS ARTICLE

Request Information From Our Sponsors
- StockCharts.com, Inc.
- Candle Patterns
- Candlestick Charting Explained
- Intermarket Technical Analysis
- John Murphy on Chart Analysis
- John Murphy's Chart Pattern Recognition
- John Murphy's Market Message
- MurphyExplainsMarketAnalysis-Intermarket Analysis
- MurphyExplainsMarketAnalysis-Visual Analysis
- StockCharts.com
- Technical Analysis of the Financial Markets
- The Visual Investor
- VectorVest, Inc.
- Executive Premier Workshop
- One-Day Options Course
- OptionsPro
- Retirement Income Workshop
- Sure-Fire Trading Systems (VectorVest, Inc.)
- Trading as a Business Workshop
- VectorVest 7 EOD
- VectorVest 7 RealTime/IntraDay
- VectorVest AutoTester
- VectorVest Educational Services
- VectorVest OnLine
- VectorVest Options Analyzer
- VectorVest ProGraphics v6.0
- VectorVest ProTrader 7
- VectorVest RealTime Derby Tool
- VectorVest Simulator
- VectorVest Variator
- VectorVest Watchdog
