HOT TOPICS LIST
- MACD
- Fibonacci
- RSI
- Gann
- ADXR
- Stochastics
- Volume
- Triangles
- Futures
- Cycles
- Volatility
- ZIGZAG
- MESA
- Retracement
- Aroon
INDICATORS LIST
LIST OF TOPICS
PRINT THIS ARTICLE
by Koos van der Merwe
When a share price rises to "king of the heap" and then crashes, is there a time of recovery?
Position: Buy
Koos van der Merwe
Has been a technical analyst since 1969, and has worked as a futures and options trader with First Financial Futures in Johannesburg, South Africa.
PRINT THIS ARTICLE
RSI
A Look At Ballard Power
05/20/14 03:42:39 PMby Koos van der Merwe
When a share price rises to "king of the heap" and then crashes, is there a time of recovery?
Position: Buy
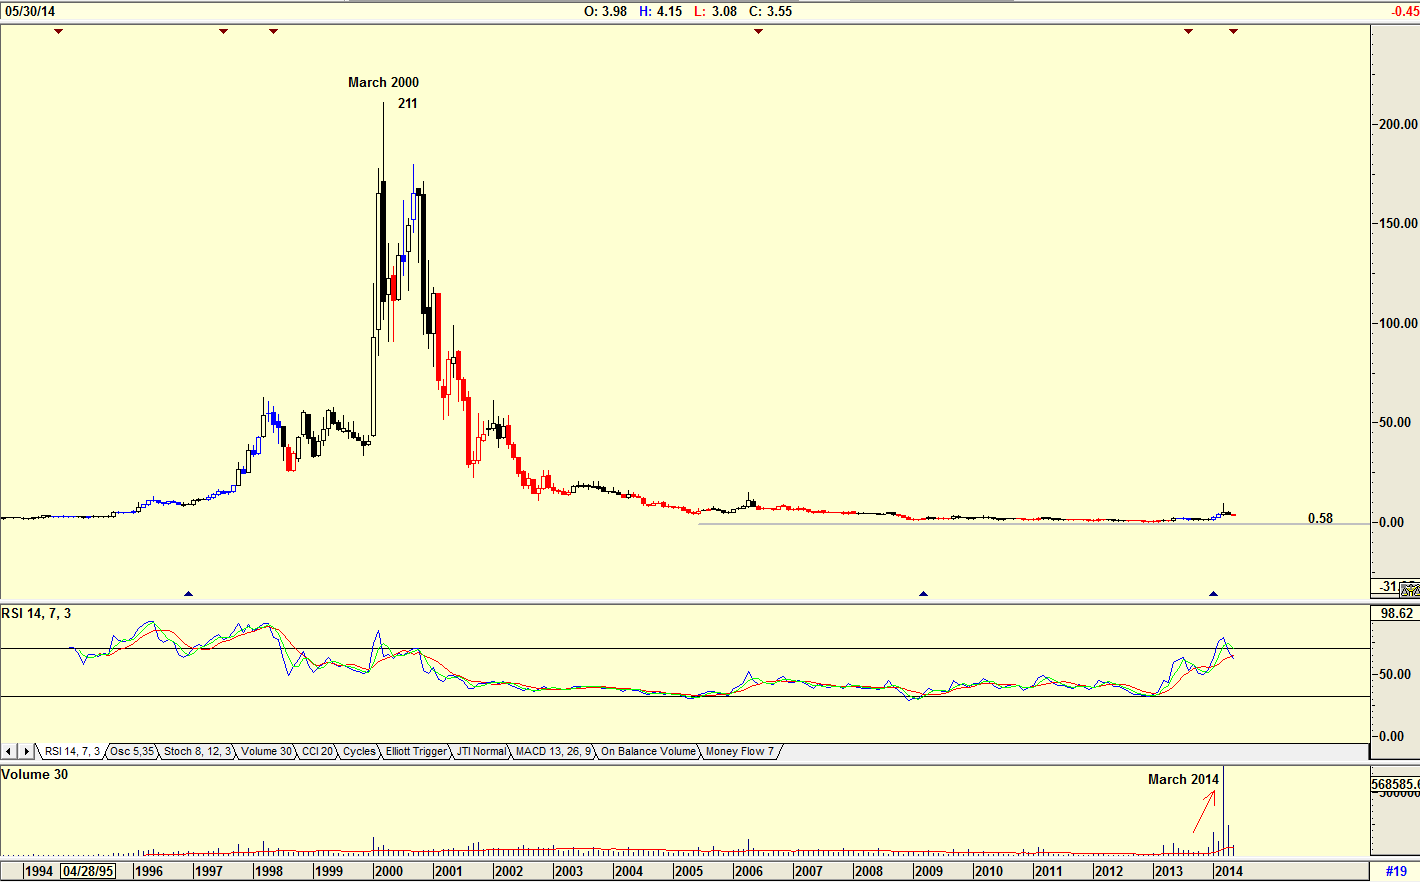
| In March 2000, the price of Ballard Power (BLD) stock reached a high of $211.00. When the technical bubble burst, BLD burst and the share price dropped to a low of 58 cents. BLD is a global leader in fuel cell technology. They are actively putting fuel cells to work in high value commercial uses. On May 13, 2014 they announced a signed agreement to deploy a fuel cell hybrid bus in 2015 at the University of California. On May 16, 2014 they announced that Tony Guglielmin, the Chief Financial Officer will discuss Ballard's strategic direction within the fast-growing fuel cell sector. On May 14, 2014 the company reported financial results for the first quarter ended March 31, 2014. The company reported a net loss of $3.87 million compared to a net loss of $8.41 million for the same quarter ended March 2013. |

|
| Figure 1. Monthly chart showing the rise and fall of Ballard Power (BLD). |
| Graphic provided by: AdvancedGET. |
| |
| The chart in Figure 1 is a monthly chart showing how the share price rose to a high of $211 by March 2000 and then collapsed to a low of 58 cents. From the chart, you can see how in March 2014 the volume traded rose strongly. Is this a sign that investors are once again becoming interested in the share? The relative strength index (RSI) is at overbought levels and has given a sell signal. Note how volume has dropped as the share price fell over the past two months: That's a sign of strength. |

|
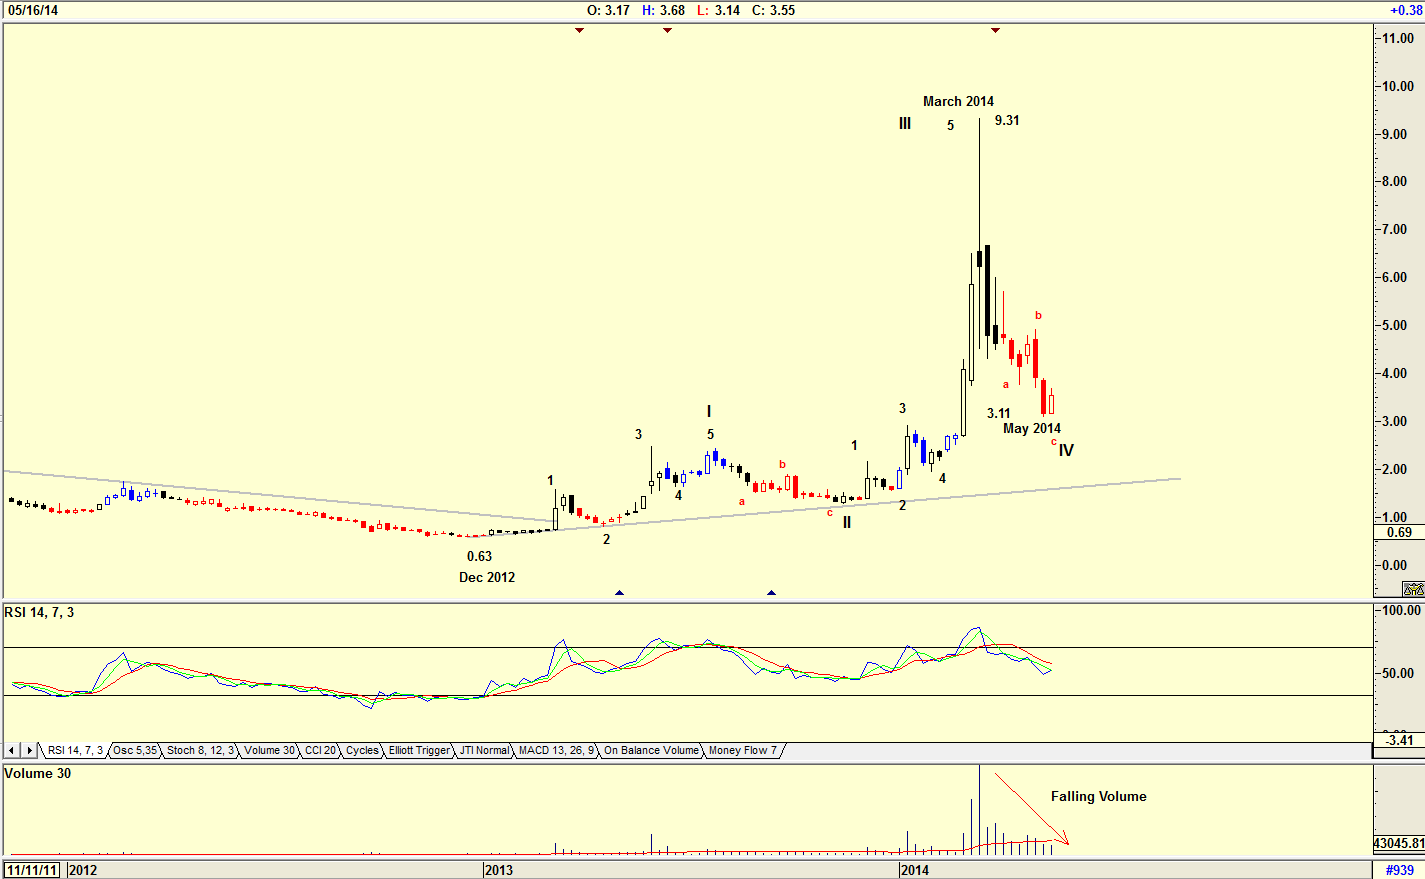
| Figure 2. Weekly chart showing a possible Elliott wave count. |
| Graphic provided by: AdvancedGET. |
| |
| The chart in Figure 2 is a weekly chart showing how the share price rose strongly from a low of 63 cents to a high of $9.31 by March 2014. From that high, with an RSI indicator that had given a sell signal, the price fell on falling volume to a low of $3.11 by May of 2014. A falling price on falling volume is a sign of strength. The Elliott wave count suggests that a WAVE IV is possibly being completed. The WAVE V that follows could take the share price above the $9.31 level. |

|
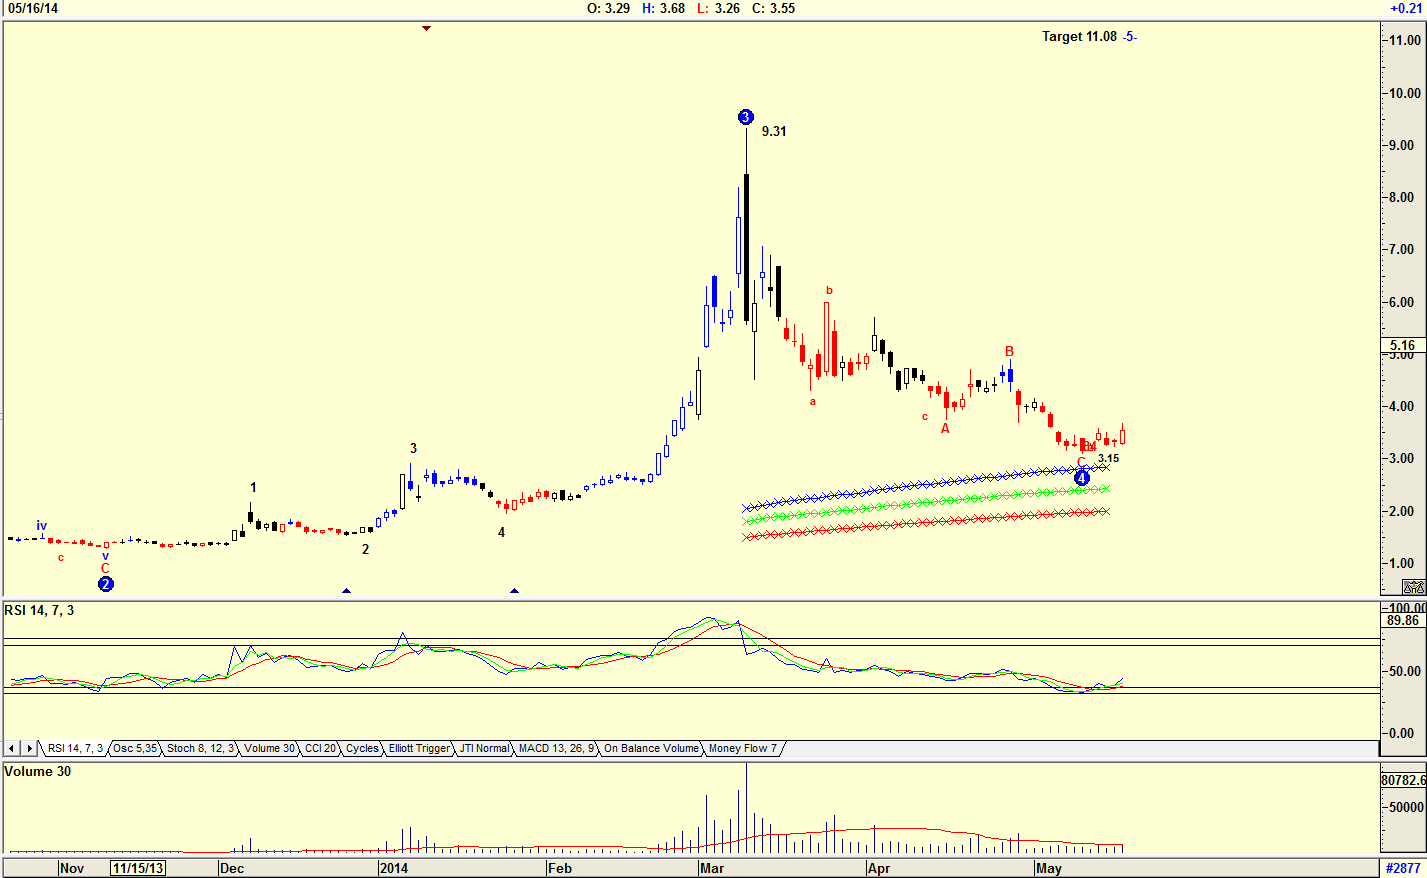
| Figure 3. Daily chart of BLD suggesting a buy. |
| Graphic provided by: AdvancedGET. |
| |
| The daily chart in Figure 3 has an Elliott wave count confirming that a WAVE 4 has been completed and that the WAVE 5 target is $11.08. The charts are saying that BLD could be a buy at the current price. With the RSI indicator at oversold levels and suggesting a buy and with a WAVE 5 target of $11.08, I would be a buyer at the present price. |
Has been a technical analyst since 1969, and has worked as a futures and options trader with First Financial Futures in Johannesburg, South Africa.
| Address: | 3256 West 24th Ave |
| Vancouver, BC | |
| Phone # for sales: | 6042634214 |
| E-mail address: | petroosp@gmail.com |
Click here for more information about our publications!
Comments
Date: 06/25/14Rank: 5Comment:

Request Information From Our Sponsors
- VectorVest, Inc.
- Executive Premier Workshop
- One-Day Options Course
- OptionsPro
- Retirement Income Workshop
- Sure-Fire Trading Systems (VectorVest, Inc.)
- Trading as a Business Workshop
- VectorVest 7 EOD
- VectorVest 7 RealTime/IntraDay
- VectorVest AutoTester
- VectorVest Educational Services
- VectorVest OnLine
- VectorVest Options Analyzer
- VectorVest ProGraphics v6.0
- VectorVest ProTrader 7
- VectorVest RealTime Derby Tool
- VectorVest Simulator
- VectorVest Variator
- VectorVest Watchdog
- StockCharts.com, Inc.
- Candle Patterns
- Candlestick Charting Explained
- Intermarket Technical Analysis
- John Murphy on Chart Analysis
- John Murphy's Chart Pattern Recognition
- John Murphy's Market Message
- MurphyExplainsMarketAnalysis-Intermarket Analysis
- MurphyExplainsMarketAnalysis-Visual Analysis
- StockCharts.com
- Technical Analysis of the Financial Markets
- The Visual Investor
