HOT TOPICS LIST
- MACD
- Fibonacci
- RSI
- Gann
- ADXR
- Stochastics
- Volume
- Triangles
- Futures
- Cycles
- Volatility
- ZIGZAG
- MESA
- Retracement
- Aroon
INDICATORS LIST
LIST OF TOPICS
PRINT THIS ARTICLE
by Billy Williams
Conoco Phillips is on the march and trading at an all-time high, but is now the time to buy?
Position: Buy
Billy Williams
Billy Williams has been trading the markets for 27 years, specializing in momentum trading with stocks and options.
PRINT THIS ARTICLE
STOCKS
Should You Buy COP Now?
05/19/14 05:25:08 PMby Billy Williams
Conoco Phillips is on the march and trading at an all-time high, but is now the time to buy?
Position: Buy
| Conoco Phillips (COP) has been a strong performer since the stock bottomed over five years ago on the heels of the 2008 housing crisis that took down the entire stock market. Since then, COP has emerged as a phoenix from the ashes, climbing back from a massive price decline and establishing a bullish trend that has lasted more than five years. Despite the strong stock performance and a trend that appears in place, will it last? That is a tough question especially when you consider that forecasting stock prices is less accurate than throwing darts at a quote sheet. However, studying past price action can give you an idea of where the stock is likely to go. |

|
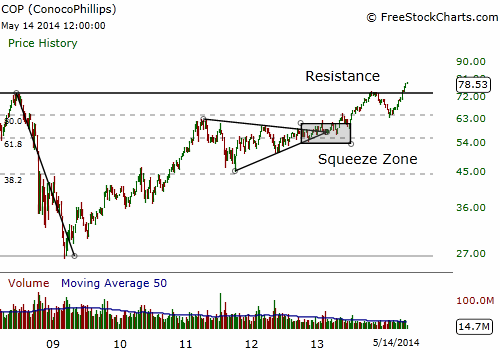
| Figure 1. Conoco Phillips (COP) got taken down with the rest of the market during 2008 but has since climbed back and recovered. On this weekly chart you see several compelling technical factors that indicate the stock will continue its bullish trend. |
| Graphic provided by: www.freestockcharts.com. |
| |
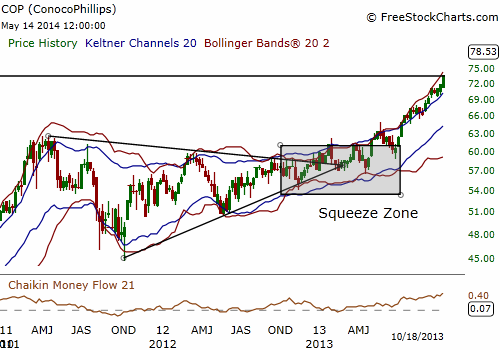
| COP bottomed on March 2009 at a low of around $26-$27 (Figure 1) but volume was light compared to other price lows that lead up to it which signaled that divergence between price and volume might signal a price reversal. Reversals can be tricky, especially in a bear market because fear and volatility can always take the market even lower, but price began to consolidate and slowly trade higher. In two years, COP's price retraced back between the .618 and .80 Fibonacci retracement levels from its decline before taking a pause and settling into a period of price contraction. The retracement to these Fibonacci zones indicated that a test of the previous price high of around $73 was likely and possibly might trade higher. From April 2011, a bullish triangle began to form in COP during its period of price contraction and the Bollinger bands on the weekly chart traded within its Keltner channels for a squeeze setup (Figure 2). Both were strong signals that a bullish breakout could occur. As price began to trade out of the triangle, it began to consolidate just above its trendline while the squeeze setup remained in effect. |

|
| Figure 2. COP began to form a bullish triangle over a two year period followed by a squeeze setup on the weekly chart. Both are strong bullish indicators and offer an opportunity to go long the stock once it breaks higher. |
| Graphic provided by: www.freestockcharts.com. |
| |
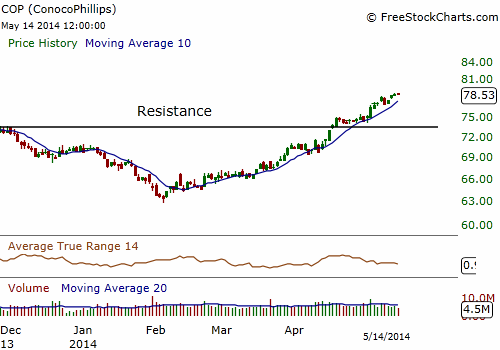
| Eventually, the Bollinger bands began to trade outside of the Keltner channels and price began to trade higher to retest the previous high of $73 in October 2013 but found resistance and traded lower from that point. COP pulled back but found support and began trading higher to retest the $73 resistance level, this time breaking through and going higher. The stock has recently traded over $78 a share and its bullish trend is still in place (Figure 3). However, can the stock continue to go higher? |

|
| Figure 3. COP tested the $73 resistance level near the end of 2013 and lost. But, since then, it has re-tested that level and gone higher. Trading at an all-time price high with no overhead resistance, COP's trend is re-established but you should wait for the stock to pull back before making any new entry. |
| Graphic provided by: www.freestockcharts.com. |
| |
| Nothing is guaranteed in trading the market but a solid trend is as good a guarantee as any trader can get, so it's likely that COP will continue to go higher. Dividend-chasers will be attracted to the stock and stick through the declines which will make the stock harder to be taken down by the bears since there are fewer sellers with motivation to dump the stock. Also, the weekly squeeze setup that was triggered has a history of sustaining price momentum for months, if not years, and it was only triggered last year. Trading at an all-time high with no overhead resistance, COP has a clear path to higher values in the foreseeable future but, that said, now is not the time to buy. Wait for COP to pull back or correct before taking a position. When it does, wait for the stock to resume its upward trend and enter as it surges higher. |
Billy Williams has been trading the markets for 27 years, specializing in momentum trading with stocks and options.
| Company: | StockOptionSystem.com |
| E-mail address: | stockoptionsystem.com@gmail.com |
Traders' Resource Links | |
| StockOptionSystem.com has not added any product or service information to TRADERS' RESOURCE. | |
Click here for more information about our publications!
Comments

|

Request Information From Our Sponsors
- StockCharts.com, Inc.
- Candle Patterns
- Candlestick Charting Explained
- Intermarket Technical Analysis
- John Murphy on Chart Analysis
- John Murphy's Chart Pattern Recognition
- John Murphy's Market Message
- MurphyExplainsMarketAnalysis-Intermarket Analysis
- MurphyExplainsMarketAnalysis-Visual Analysis
- StockCharts.com
- Technical Analysis of the Financial Markets
- The Visual Investor
- VectorVest, Inc.
- Executive Premier Workshop
- One-Day Options Course
- OptionsPro
- Retirement Income Workshop
- Sure-Fire Trading Systems (VectorVest, Inc.)
- Trading as a Business Workshop
- VectorVest 7 EOD
- VectorVest 7 RealTime/IntraDay
- VectorVest AutoTester
- VectorVest Educational Services
- VectorVest OnLine
- VectorVest Options Analyzer
- VectorVest ProGraphics v6.0
- VectorVest ProTrader 7
- VectorVest RealTime Derby Tool
- VectorVest Simulator
- VectorVest Variator
- VectorVest Watchdog
