

HOT TOPICS LIST
- MACD
- Fibonacci
- RSI
- Gann
- ADXR
- Stochastics
- Volume
- Triangles
- Futures
- Cycles
- Volatility
- ZIGZAG
- MESA
- Retracement
- Aroon
INDICATORS LIST
LIST OF TOPICS
PRINT THIS ARTICLE
by Donald W. Pendergast, Jr.
Here's a brief tutorial on what to be aware of when evaluating a potential channel breakout setup in stocks.
Position: N/A
Donald W. Pendergast, Jr.
Freelance financial markets writer and online publisher of the Trendzetterz.com S&P 500 Weekly Forecast service.
PRINT THIS ARTICLE
TRITOP/TRI BOTTOM
GD - Bullish Or Bearish Pattern
05/16/14 02:57:37 PMby Donald W. Pendergast, Jr.
Here's a brief tutorial on what to be aware of when evaluating a potential channel breakout setup in stocks.
Position: N/A
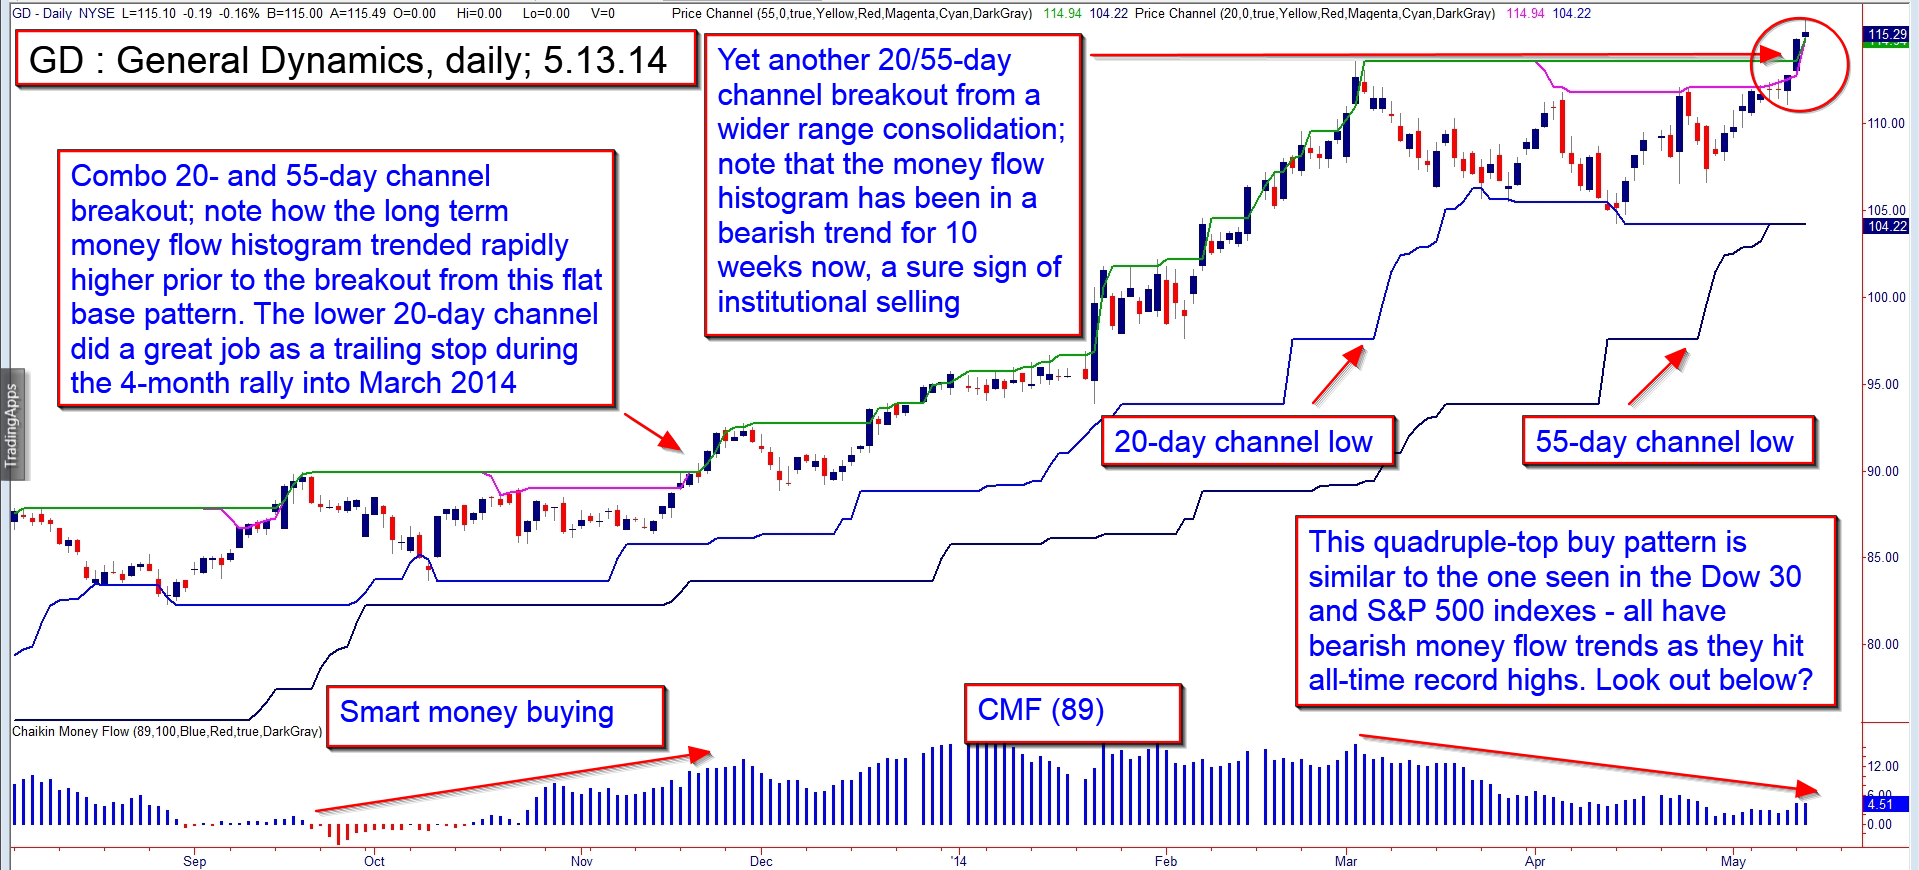
| Flat base channel breakout patterns don't appear every day in the stock market, but when they do they can lead to powerful, sustained trending moves in liquid stocks. Here's a look at two such patterns on General Dynamic's (GD) daily chart in Figure 1, along with a few valuable tips on what to be looking for when these patterns manifest. |
|
| Figure 1. A bullish breakout from a narrow range base — particularly if long term money flows are positive — can lead to sustained trending moves. |
| Graphic provided by: TradeStation. |
| |
| Of the four flat base patterns seen on GD's daily chart since early 2013, two were very attractive and the other two were somewhat misshapen and questionable at best: 1. May/June 2013 was a wonderful, low volatility pattern and very successful. 2. September/November 2013 was a wider range pattern but also led to a major rally. 3. The December 2013/January 2014 pattern was ultra low volatility and proved to be yet another bullish launch pad. 4. Finally, the most recent (and as yet, successful) flat base pattern is also the most volatile, with wide swings — forming a quadruple-top buy pattern and a 20-/55-day channel breakout. Whether or not this latest surge upward by GD will result in more trend following gains is unknown, but here are some observations regarding these four distinct FBB (flat base breakout) patterns: A. The narrower the ranges and smaller the price swings prior to the 20/55 channel break, the higher the probability of a sustained trending move. B. Money flows matter — ideally, you want to see the 89-day Chaikin Money flow (CMF)(89) remain well above its zero line during the entire formation of the pattern prior to breaking higher. Alternatively, if the same money flow histogram moves steadily from negative to positive territory by the time of the 20/55 channel break, that is also a sign of a high probability bullish move ahead (the smart money building a big long position in a short amount of time). C. FBB breakouts near all-time highs, especially after several major bullish FBB's have already completed in the previous 12 to 18 months may be more risky to trade, especially if the ranges are wide and the daily chart price swings are sharp — like you see just prior to GD's latest breakout. And if the money flow trend reveals multimonth institutional selling prior to such an FBB breakout, be all the more cautious before jumping onboard. |
|
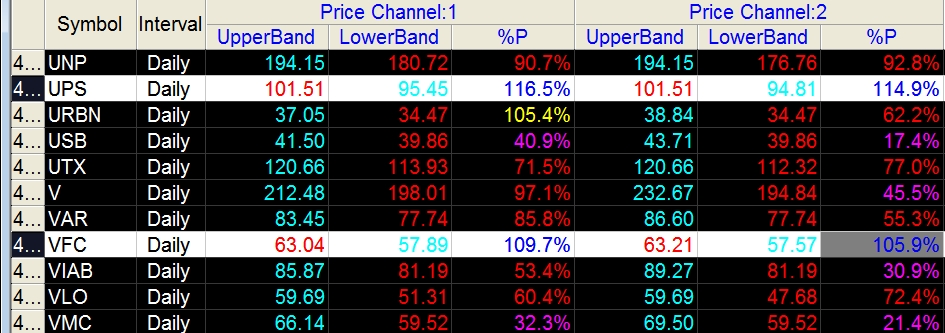
| Figure 2. Several other S&P 500 index components (.SPX) are also manifesting bullish 20-/50-day channel breakouts, such as UPS and VFC. |
| Graphic provided by: TradeStation. |
| Graphic provided by: TradeStation RadarScreen. |
| |
| A simple way to determine if an FBB pattern may be risky is to look at the point or percentage spread between the 20-day channel highs and lows; if a latter appearing FBB has a channel spread nearly double that of previous successful FBB's then be wary of going long. For example, the spread at the time of the November 2013 FBB break was about 5%, whereas yesterday's FBB breakout spread was nearly 8% — a sizable difference. GD's quadruple-top buy pattern is similar to patterns seen in the S&P 500 (.SPX) and Dow 30 Industrial (.DJIA) indexes in that all are manifesting seriously negative long-term money flow divergences with the price action on their daily charts. Be aware of that as you seek your next low risk trading setup in the US markets and trade wisely until we meet here again. |
Freelance financial markets writer and online publisher of the Trendzetterz.com S&P 500 Weekly Forecast service.
| Title: | Market consultant and writer |
| Company: | Trendzetterz |
| Address: | 81 Hickory Hollow Drive |
| Crossville, TN 38555 | |
| Phone # for sales: | 904-303-4814 |
| Website: | trendzetterz.com |
| E-mail address: | support@trendzetterz.com |
Traders' Resource Links | |
| Trendzetterz has not added any product or service information to TRADERS' RESOURCE. | |
Click here for more information about our publications!
PRINT THIS ARTICLE

Request Information From Our Sponsors
- StockCharts.com, Inc.
- Candle Patterns
- Candlestick Charting Explained
- Intermarket Technical Analysis
- John Murphy on Chart Analysis
- John Murphy's Chart Pattern Recognition
- John Murphy's Market Message
- MurphyExplainsMarketAnalysis-Intermarket Analysis
- MurphyExplainsMarketAnalysis-Visual Analysis
- StockCharts.com
- Technical Analysis of the Financial Markets
- The Visual Investor
- VectorVest, Inc.
- Executive Premier Workshop
- One-Day Options Course
- OptionsPro
- Retirement Income Workshop
- Sure-Fire Trading Systems (VectorVest, Inc.)
- Trading as a Business Workshop
- VectorVest 7 EOD
- VectorVest 7 RealTime/IntraDay
- VectorVest AutoTester
- VectorVest Educational Services
- VectorVest OnLine
- VectorVest Options Analyzer
- VectorVest ProGraphics v6.0
- VectorVest ProTrader 7
- VectorVest RealTime Derby Tool
- VectorVest Simulator
- VectorVest Variator
- VectorVest Watchdog