HOT TOPICS LIST
- MACD
- Fibonacci
- RSI
- Gann
- ADXR
- Stochastics
- Volume
- Triangles
- Futures
- Cycles
- Volatility
- ZIGZAG
- MESA
- Retracement
- Aroon
INDICATORS LIST
LIST OF TOPICS
PRINT THIS ARTICLE
by Matt Blackman
If earnings and revenue growth do indeed power stock prices, this stock could still have a long way to run.
Position: N/A
Matt Blackman
Matt Blackman is a full-time technical and financial writer and trader. He produces corporate and financial newsletters, and assists clients in getting published in the mainstream media. He is the host of TradeSystemGuru.com. Matt has earned the Chartered Market Technician (CMT) designation. Find out what stocks and futures Matt is watching on Twitter at www.twitter.com/RatioTrade
PRINT THIS ARTICLE
LINEAR REG CHANNEL
GasLog - Unassuming Earnings & Revenue Star
05/16/14 02:49:30 PMby Matt Blackman
If earnings and revenue growth do indeed power stock prices, this stock could still have a long way to run.
Position: N/A
| Technical traders can often lose sight of what drives stock prices higher — and it's not always rising revenues and earnings growth but rather the perception by investors that both have the potential to accelerate. One look at the chart of Liquefied Natural Gas (LNG) carrier GasLog Partners Ltd (GLOG) showing the strong uptrend and it's clear to see that investors have been happy with the company's growth prospects. |

|
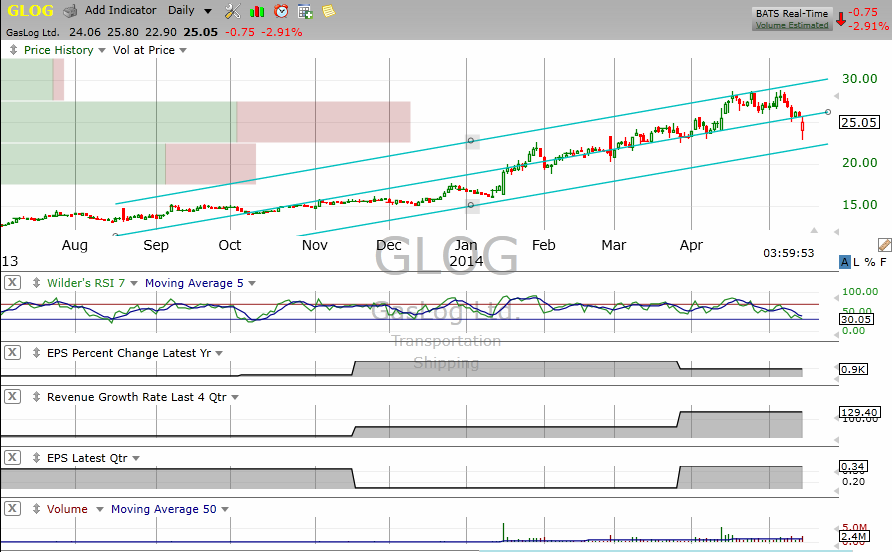
| Figure 1 – Daily chart of GasLog Ltd. showing the strong uptrend and linear regression channel the stock has traded in over the last six months. Note the continually improving fundamentals in the stock with earnings per share rising at nearly 1000% as of the latest data. |
| Graphic provided by: TC2000.com. |
| |
| As you see from Figure 1, the company has exhibited a continually improving revenue and earnings picture with earnings per share growing at 900% annually with revenues improving at 129% as of the Q4-2013 quarterly report. This chart was taken after the company reported Q1-2014 results May 14. As you see from Figure 1, shares dropped 11% immediately after earnings, were reported in the morning but had recovered nicely by the close of the trading day for a loss of 2.9% on the day. Not bad considering that Q1 earnings on an adjusted basis of $0.13/share came in $0.03 below expectations. Energy stocks have been performing strongly in 2014 as have those in related industries. |

|
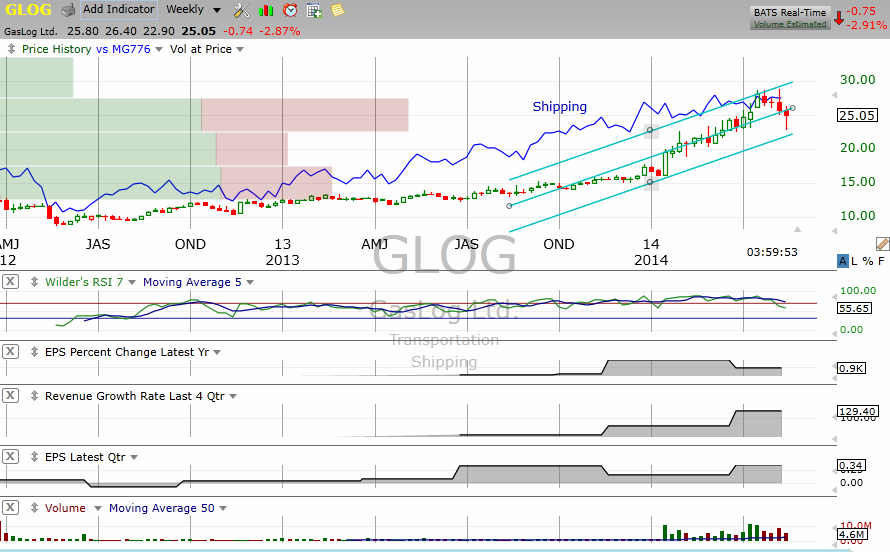
| Figure 2 – Longer-term weekly chart showing the trend of the stock together with the shipping industry (blue line) which has continued to appreciate inside its upward sloping linear regression line for nearly a year. |
| Graphic provided by: TC2000.com. |
| |
| GasLog Partners LP recently raised $199 million through an initial public offering of 9.7 million shares at $21 according to Comtex, which helped push its price lower but given the company's strong earnings, this effect should be relatively limited. As long as the stock remains in its upward sloping linear regression channel seen in Figure 1, a viable strategy would be to buy as it bounces off the lower channel line or as it passes up through the channel mid-line on a rising RSI. |
Matt Blackman is a full-time technical and financial writer and trader. He produces corporate and financial newsletters, and assists clients in getting published in the mainstream media. He is the host of TradeSystemGuru.com. Matt has earned the Chartered Market Technician (CMT) designation. Find out what stocks and futures Matt is watching on Twitter at www.twitter.com/RatioTrade
| Company: | TradeSystemGuru.com |
| Address: | Box 2589 |
| Garibaldi Highlands, BC Canada | |
| Phone # for sales: | 604-898-9069 |
| Fax: | 604-898-9069 |
| Website: | www.tradesystemguru.com |
| E-mail address: | indextradermb@gmail.com |
Traders' Resource Links | |
| TradeSystemGuru.com has not added any product or service information to TRADERS' RESOURCE. | |
Click here for more information about our publications!
Comments

|

Request Information From Our Sponsors
- StockCharts.com, Inc.
- Candle Patterns
- Candlestick Charting Explained
- Intermarket Technical Analysis
- John Murphy on Chart Analysis
- John Murphy's Chart Pattern Recognition
- John Murphy's Market Message
- MurphyExplainsMarketAnalysis-Intermarket Analysis
- MurphyExplainsMarketAnalysis-Visual Analysis
- StockCharts.com
- Technical Analysis of the Financial Markets
- The Visual Investor
- VectorVest, Inc.
- Executive Premier Workshop
- One-Day Options Course
- OptionsPro
- Retirement Income Workshop
- Sure-Fire Trading Systems (VectorVest, Inc.)
- Trading as a Business Workshop
- VectorVest 7 EOD
- VectorVest 7 RealTime/IntraDay
- VectorVest AutoTester
- VectorVest Educational Services
- VectorVest OnLine
- VectorVest Options Analyzer
- VectorVest ProGraphics v6.0
- VectorVest ProTrader 7
- VectorVest RealTime Derby Tool
- VectorVest Simulator
- VectorVest Variator
- VectorVest Watchdog
