

HOT TOPICS LIST
- MACD
- Fibonacci
- RSI
- Gann
- ADXR
- Stochastics
- Volume
- Triangles
- Futures
- Cycles
- Volatility
- ZIGZAG
- MESA
- Retracement
- Aroon
INDICATORS LIST
LIST OF TOPICS
PRINT THIS ARTICLE
by Donald W. Pendergast, Jr.
The bulls see a triple-top buying pattern and the bears see a poor money flow trend - who's right?
Position: N/A
Donald W. Pendergast, Jr.
Freelance financial markets writer and online publisher of the Trendzetterz.com S&P 500 Weekly Forecast service.
PRINT THIS ARTICLE
BREAKOUTS
DIA: Bull Trap Or Significant Rally?
05/16/14 10:51:59 AMby Donald W. Pendergast, Jr.
The bulls see a triple-top buying pattern and the bears see a poor money flow trend - who's right?
Position: N/A
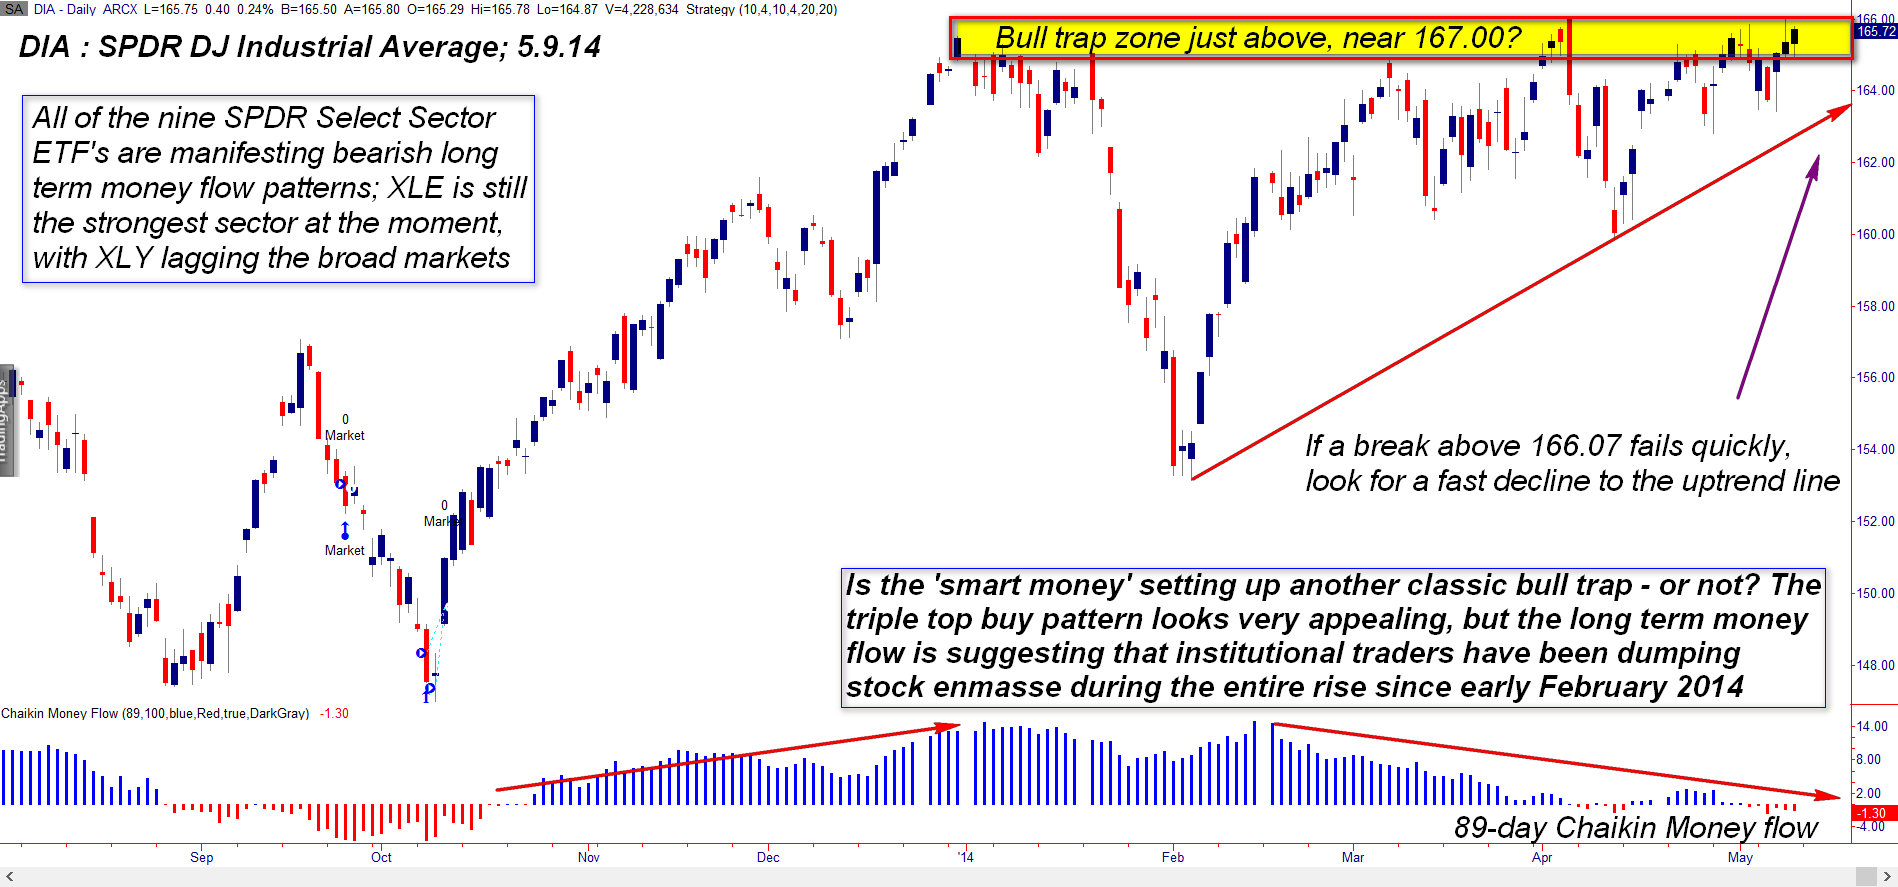
| The two corrections seen in the Dow 30 Industrials (.DJIA, DIA) since early 2014 varied in intensity from "semi-scary" (January/February) to "no big deal" (April); what the bears may not have noticed, however, is that the DIA was also tracing out a bullish looking triple top buy pattern &madsh; one that became plain to see as the nice rally out of the early February 2014 cycle low played out. Here's a look at that pattern now, along with a sobering look at the very weak long-term money flow trend that has also been developing. |
|
| Figure 1. SPDR DJ Industrial Average ETF (DIA): A potentially bearish divergence between price action and long term money flow is firmly in place. |
| Graphic provided by: TradeStation. |
| |
| The perma-bears (I used to be one myself) must have really been viewing the early 2014 sell-off in DIA as a long-awaited gift — and indeed it was, for a few weeks. But the DIA just keeps bouncing back, and is once again near a new all-time high, frustrating the bears who are expecting a major trend reversal to correct the outsized gains seen since March 2009's mega bull run. Here's the basic scenario for the DIA (Figure 1): 1. A bullish triple top buy pattern is close to being triggered, once DIA breaks above 166.70. 2. The S&P 500 index (.SPX, SPY) is also manifesting a similarly bullish pattern. 3. Long-term money flows are barely positive for the SPY and are still negative for the DIA. 4. Institutional traders (big investment banks, mutual funds, etc.) appear to have been selling out of their long positions all the way up since the February '14 lows. Long-term bullish money flow is a key driver of every sustained market rally, and when a stock or major stock index is at/near all-time highs without corresponding confirmation by money flows, a negative divergence is in place. For all anyone knows, DIA and SPY will be able to rally further, but until money flows improve, be cautious if taking daily/weekly based long equity positions unless: 1. The stock and its industry group is outperforming the .SPX over the past 13 weeks. 2. The stock is emerging from a flat base pattern or rallying from a key support test. 3. Long-term money flows (89-day Chaikin Money flow histogram ([CMF][89]) should be positive and trending higher. 4. You should also have a good risk/reward ratio for any long trade setups, along with rational stop loss and profit targets. |
|
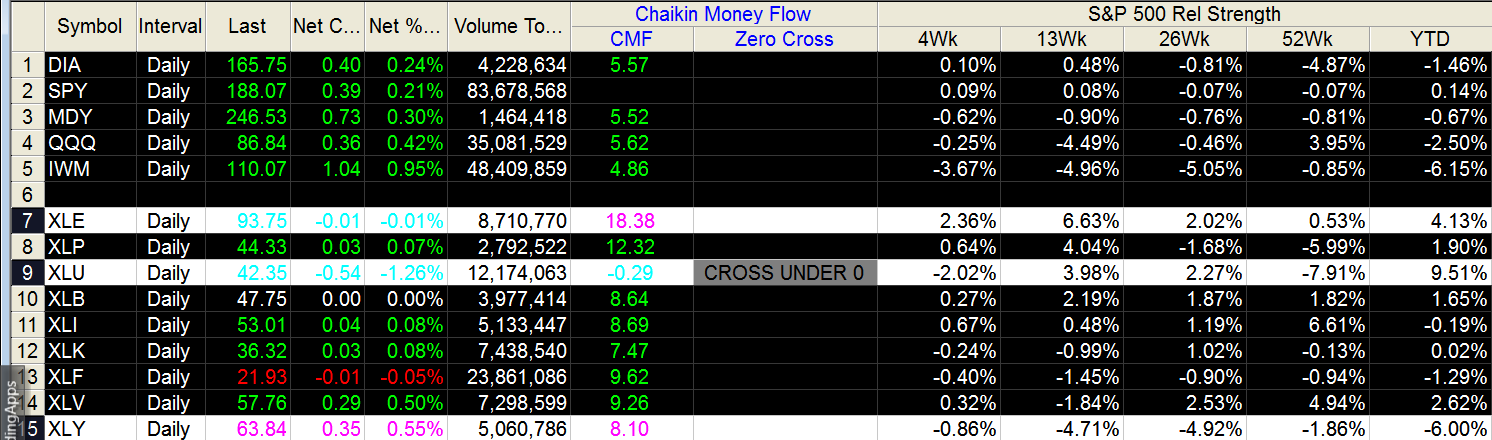
| Figure 2. The Energy (XLE) sector stocks continue to lead the .SPX higher; Utilities (XLU) now have negative 21-day Chaikin Money flow and Consumer Discretionary stocks (XLY) continue to underperform. |
| Graphic provided by: TradeStation. |
| Graphic provided by: TradeStation RadarScreen. |
| |
| In due time, there will be a substantial correction of the epic rally that launched in March 2009, but attempting to forecast the precise turning point is a virtually impossible task, even for a skilled technician or trader. Following the dominant trend is still the most prudent course of action, using every available edge you can find, while keeping your account risk at a modest level. As always, trade wisely until we meet here again. |
Freelance financial markets writer and online publisher of the Trendzetterz.com S&P 500 Weekly Forecast service.
| Title: | Market consultant and writer |
| Company: | Trendzetterz |
| Address: | 81 Hickory Hollow Drive |
| Crossville, TN 38555 | |
| Phone # for sales: | 904-303-4814 |
| Website: | trendzetterz.com |
| E-mail address: | support@trendzetterz.com |
Traders' Resource Links | |
| Trendzetterz has not added any product or service information to TRADERS' RESOURCE. | |
Click here for more information about our publications!
Comments

Request Information From Our Sponsors
- VectorVest, Inc.
- Executive Premier Workshop
- One-Day Options Course
- OptionsPro
- Retirement Income Workshop
- Sure-Fire Trading Systems (VectorVest, Inc.)
- Trading as a Business Workshop
- VectorVest 7 EOD
- VectorVest 7 RealTime/IntraDay
- VectorVest AutoTester
- VectorVest Educational Services
- VectorVest OnLine
- VectorVest Options Analyzer
- VectorVest ProGraphics v6.0
- VectorVest ProTrader 7
- VectorVest RealTime Derby Tool
- VectorVest Simulator
- VectorVest Variator
- VectorVest Watchdog
- StockCharts.com, Inc.
- Candle Patterns
- Candlestick Charting Explained
- Intermarket Technical Analysis
- John Murphy on Chart Analysis
- John Murphy's Chart Pattern Recognition
- John Murphy's Market Message
- MurphyExplainsMarketAnalysis-Intermarket Analysis
- MurphyExplainsMarketAnalysis-Visual Analysis
- StockCharts.com
- Technical Analysis of the Financial Markets
- The Visual Investor