HOT TOPICS LIST
- MACD
- Fibonacci
- RSI
- Gann
- ADXR
- Stochastics
- Volume
- Triangles
- Futures
- Cycles
- Volatility
- ZIGZAG
- MESA
- Retracement
- Aroon
INDICATORS LIST
LIST OF TOPICS
PRINT THIS ARTICLE
by Koos van der Merwe
One Elliot wave rule is that a wave 5 is equal to a wave 1.
Position: Buy
Koos van der Merwe
Has been a technical analyst since 1969, and has worked as a futures and options trader with First Financial Futures in Johannesburg, South Africa.
PRINT THIS ARTICLE
ELLIOTT WAVE
That Wave 5
05/16/14 10:45:57 AMby Koos van der Merwe
One Elliot wave rule is that a wave 5 is equal to a wave 1.
Position: Buy
| The rule about wave 5 being equal to a wave 1 is a beautiful rule. The only problem is that complicated 5th wave, like rising pennants, or frustrated fundamental bears anticipating the correction once the wave is complete can cause investors to leave the market prematurely, causing the wave to fail. Nevertheless, keeping this in mind and predicting the future of the market movement using technical analysis, you should never forget that Elliott wave analysis is purely a signpost in the wilderness — a signpost that can change a little way down the road. |

|
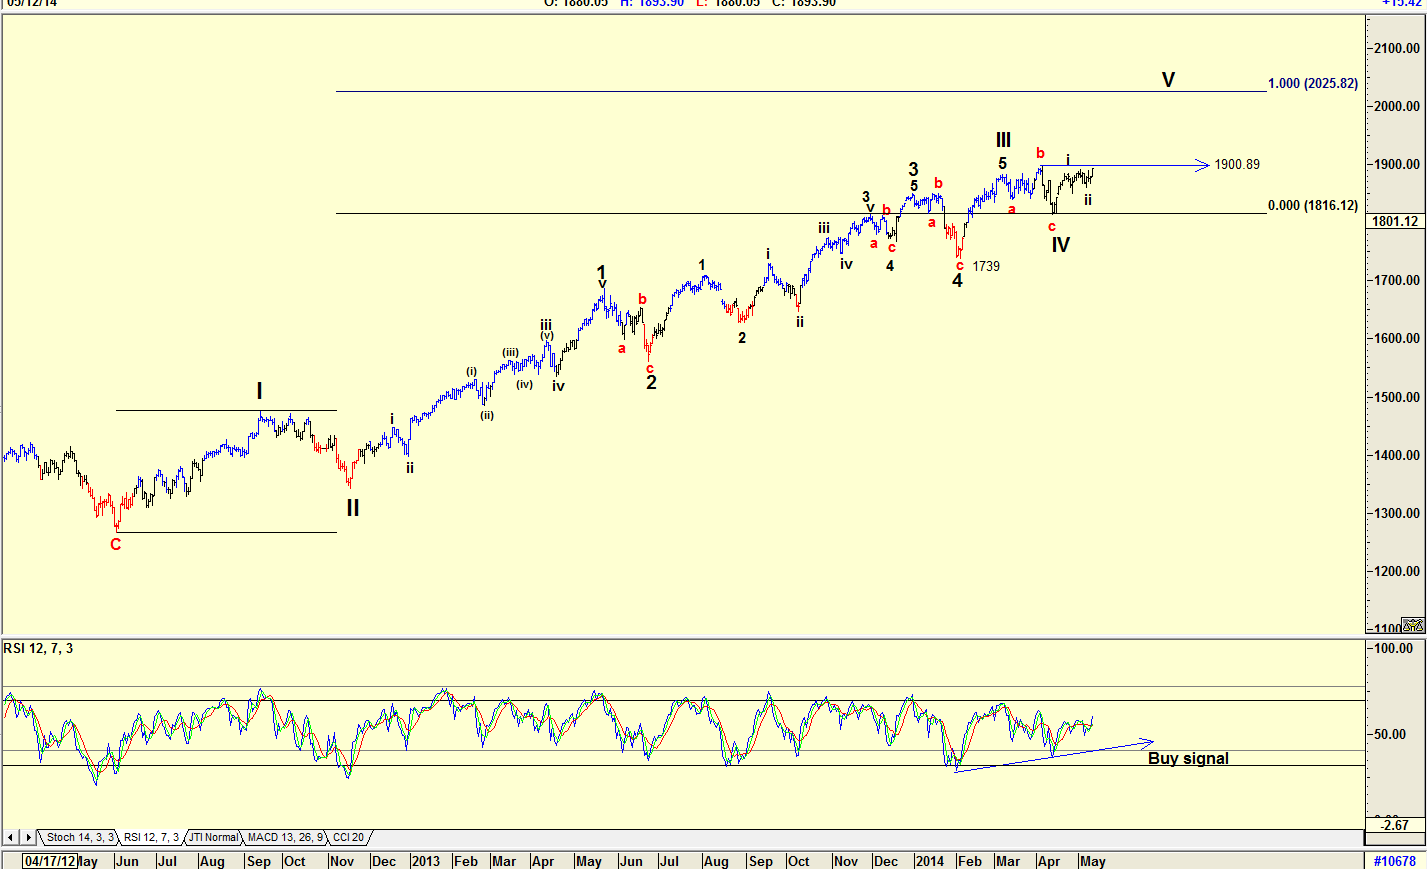
| Figure 1. Daily chart of the S&P 500 index showing the Elliott wave count. |
| Graphic provided by: AdvancedGET. |
| |
| The chart in Figure 1 is a daily chart of the S&P500 index with an Elliott wave count showing that the index is in a WAVE V with a target of 2025.82. This target is based on the Elliott wave rule that Wave 5 is equal to Wave 1. The rising bottoms shown on the RSI indicator suggests that the index should rise, but and there is a but, there is resistance at 1900.89, the high of wave b. Should price rise above this level, in what should be a wave iii of WAVE V, then the target could well be reached. Of course once WAVE V has topped, there will be a major ABC correction that will see the S&P 500 index fall to the 4th wave of lesser degree, that is as low as 1739. Of course then the bears will jump for joy and shout from the rooftops, "We told you to watch out!" |

|
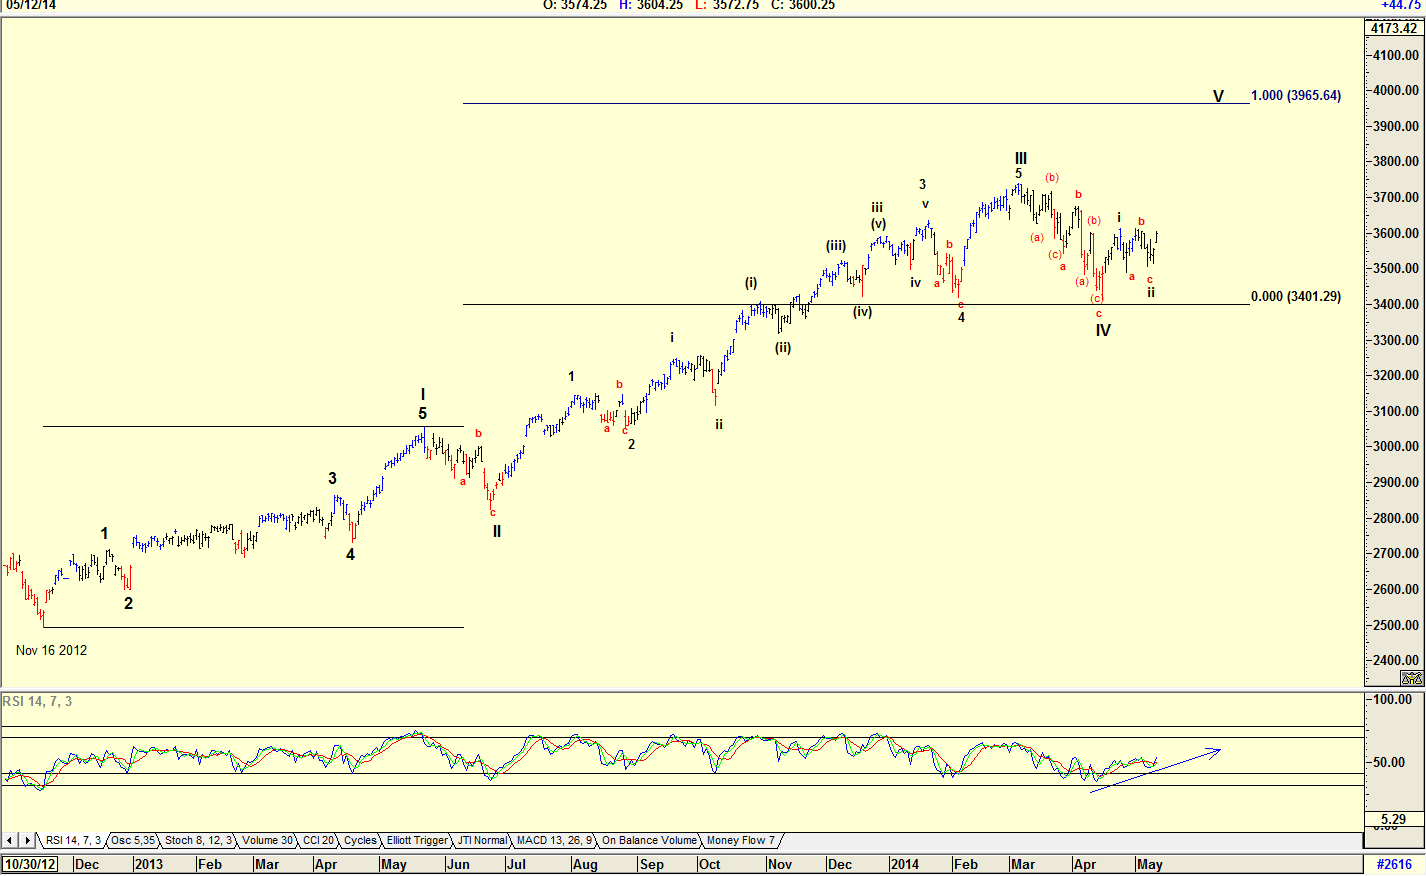
| Figure 2. Daily chart of the Nasdaq with an Elliott wave count. |
| Graphic provided by: AdvancedGET. |
| |
| With the Nasdaq 100 Index, the WAVE V target is 3965.64. The chart is also suggesting that the index is in a wave iii of WAVE V. Once again, the RSI is in a positive trend. |

|
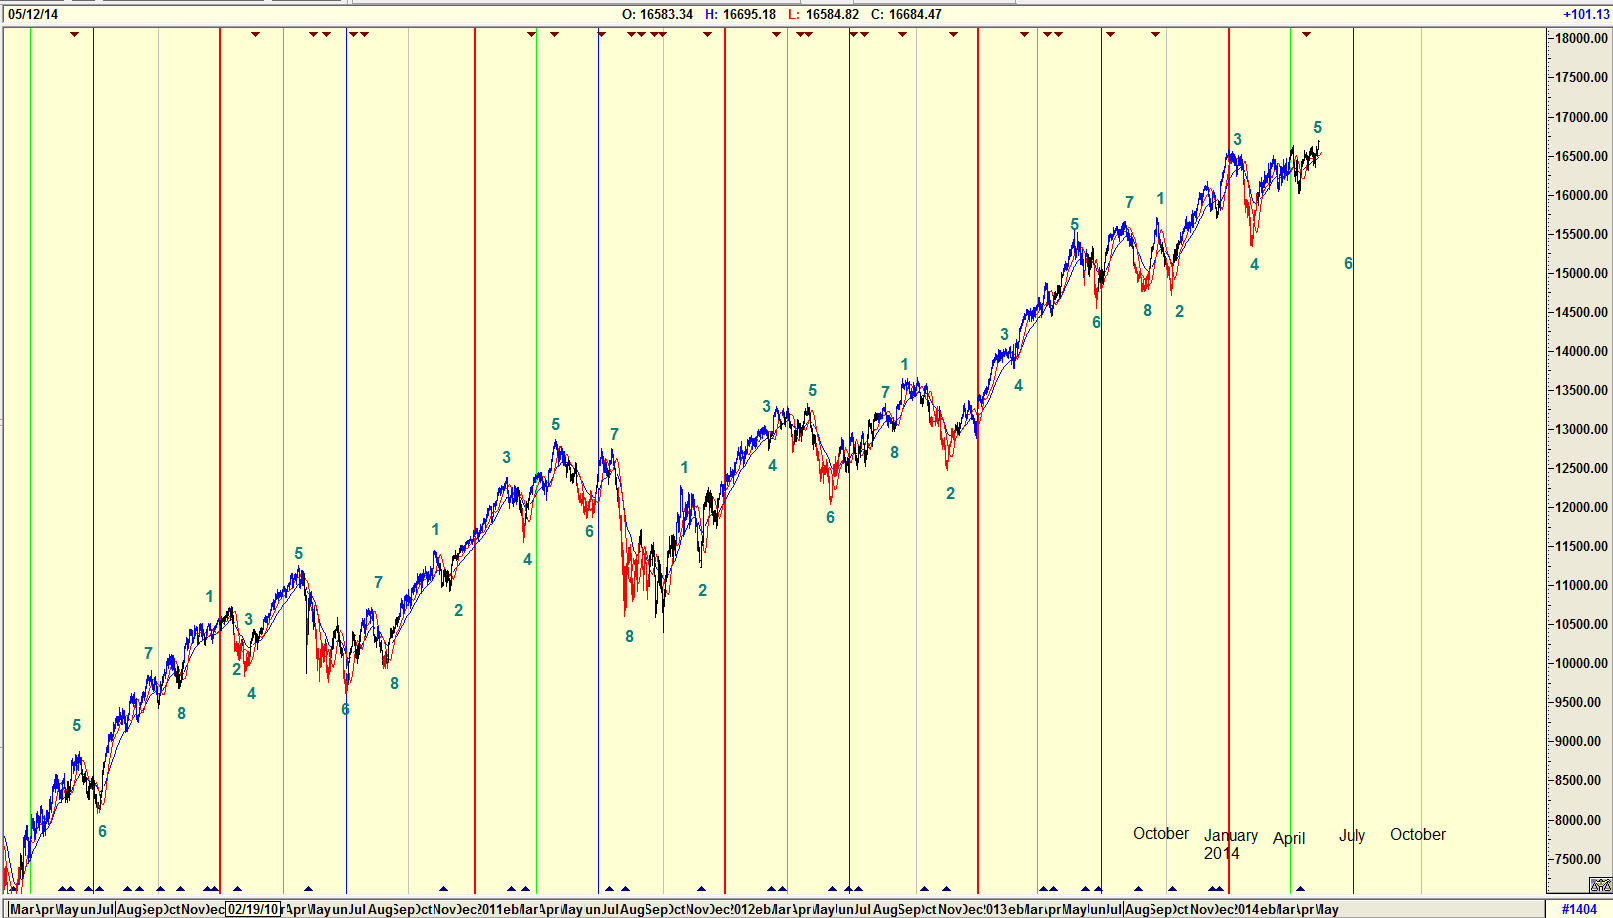
| Figure 3. Here you see the Paget cycle analysis of the Dow Jones Industrial Average (DJIA). |
| Graphic provided by: AdvancedGET. |
| |
| What about the "sell in May" mantra? Here I look at the Paget cycle as shown in Figure 3. Roger Paget, a man that was 82 years old when I met him in the early 1980's in South Africa, developed a cycle strategy that I still follow. The chart in Figure 3 shows how he would divide a year into quarters, coloring each quarter with a crayon (because he couldn't use a computer). Looking back over past history, you can see that every year sometime between April and July (#5) a correction occurred. The correction in some cases bottomed before July 1, sometime in June. So, keeping this in mind, we can expect a correction to occur in the coming weeks. |

|
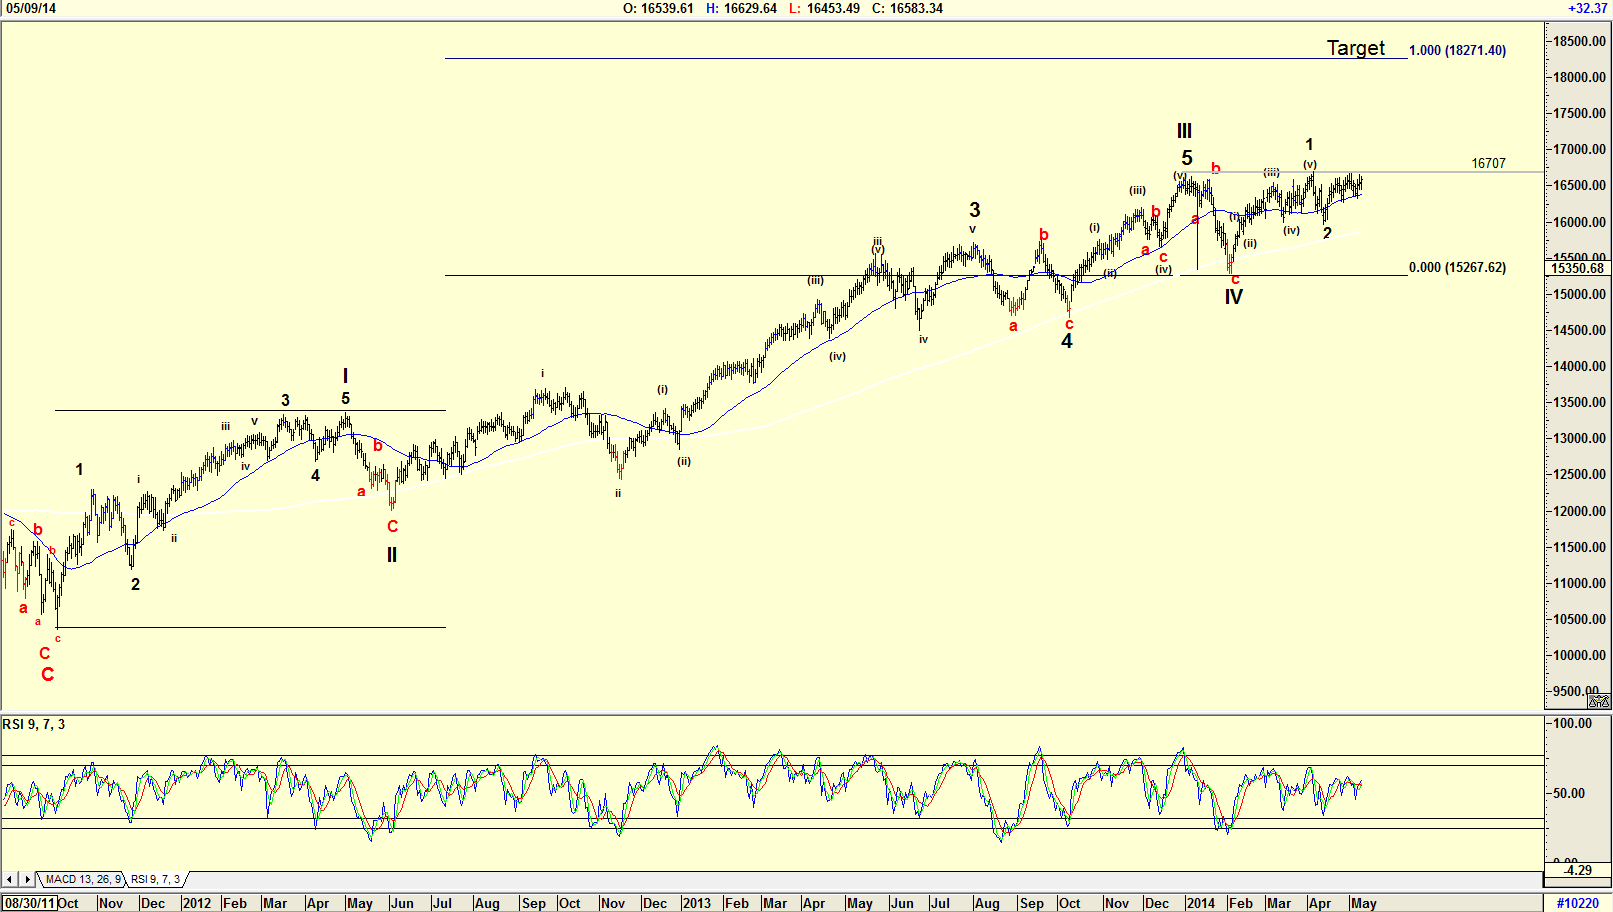
| Figure 4: The chart of the DJIA with Elliott wave count. |
| Graphic provided by: AdvancedGET. |
| |
| Finally, a look at the daily chart of the Dow Jones Industrial Average. Once again we see that the Elliott wave count suggests that the Dow is moving into a WAVE V with a target of 18271.40. Here the 'but' is the resistance that has formed at 16707 with the index moving sideways and the RSI also uncertain as to the movement of the index. WAVE 5 is on the cards. It should happen, but with the bearish sentiment out there the wave could only move up gradually as confidence returns to market. Be prepared for a WAVE V that will move up slowly. Should WAVE V top out in the next few weeks as a flat wave, following the Paget cycle, then the ABC correction that follows that WAVE V will also be flat and not be equal to Wave 1. |
Has been a technical analyst since 1969, and has worked as a futures and options trader with First Financial Futures in Johannesburg, South Africa.
| Address: | 3256 West 24th Ave |
| Vancouver, BC | |
| Phone # for sales: | 6042634214 |
| E-mail address: | petroosp@gmail.com |
Click here for more information about our publications!
Comments
Date: 06/15/15Rank: 4Comment:

Request Information From Our Sponsors
- StockCharts.com, Inc.
- Candle Patterns
- Candlestick Charting Explained
- Intermarket Technical Analysis
- John Murphy on Chart Analysis
- John Murphy's Chart Pattern Recognition
- John Murphy's Market Message
- MurphyExplainsMarketAnalysis-Intermarket Analysis
- MurphyExplainsMarketAnalysis-Visual Analysis
- StockCharts.com
- Technical Analysis of the Financial Markets
- The Visual Investor
- VectorVest, Inc.
- Executive Premier Workshop
- One-Day Options Course
- OptionsPro
- Retirement Income Workshop
- Sure-Fire Trading Systems (VectorVest, Inc.)
- Trading as a Business Workshop
- VectorVest 7 EOD
- VectorVest 7 RealTime/IntraDay
- VectorVest AutoTester
- VectorVest Educational Services
- VectorVest OnLine
- VectorVest Options Analyzer
- VectorVest ProGraphics v6.0
- VectorVest ProTrader 7
- VectorVest RealTime Derby Tool
- VectorVest Simulator
- VectorVest Variator
- VectorVest Watchdog
