HOT TOPICS LIST
- MACD
- Fibonacci
- RSI
- Gann
- ADXR
- Stochastics
- Volume
- Triangles
- Futures
- Cycles
- Volatility
- ZIGZAG
- MESA
- Retracement
- Aroon
INDICATORS LIST
LIST OF TOPICS
PRINT THIS ARTICLE
by Koos van der Merwe
The Russell 2000 index measures the performance of the small-cap segment of the U.S. equity universe.
Position: Accumulate
Koos van der Merwe
Has been a technical analyst since 1969, and has worked as a futures and options trader with First Financial Futures in Johannesburg, South Africa.
PRINT THIS ARTICLE
ELLIOTT WAVE
A Look At The Russell 2000
05/14/14 04:40:55 PMby Koos van der Merwe
The Russell 2000 index measures the performance of the small-cap segment of the U.S. equity universe.
Position: Accumulate
| The Russell 2000 index includes approximately 2000 of the smallest securities based on a combination of their market cap and current index membership. The index is constructed to provide a comprehensive and unbiased small-cap barometer. It is completely reconstituted annually to ensure larger stocks do not distort the performance and characteristics of the true small-cap opportunity set. |

|
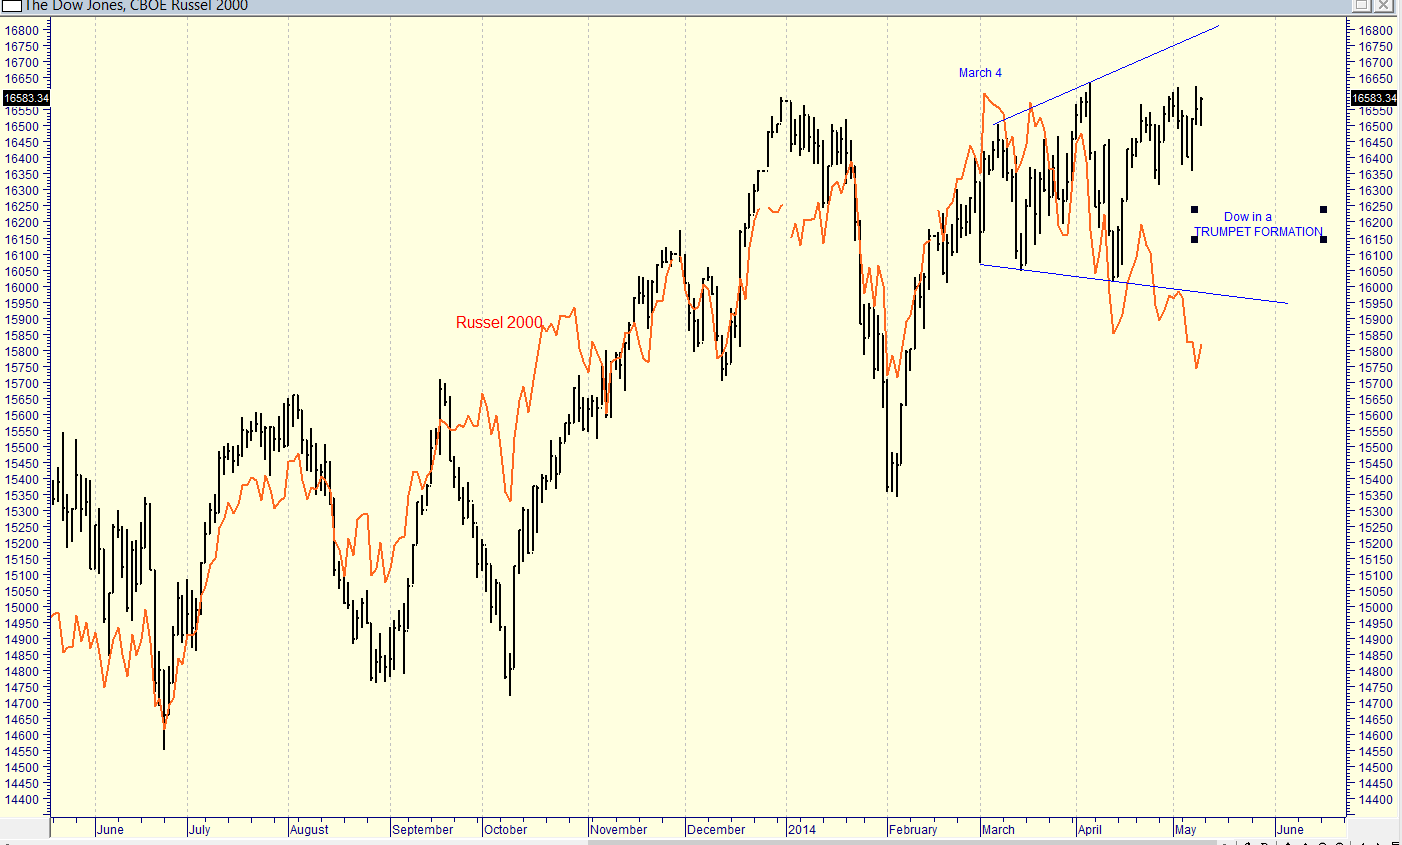
| Figure 1. Russell 2000 Index and the Dow Jones Industrial Average. |
| Graphic provided by: MetaStock. |
| |
| In the chart in Figure 1 the Russell 2000 index is superimposed over the Dow Jones from June 2013 to the present. Notice how closely the Dow and the Russell 2000 tracked each other until March 4, 2014 when the Russell 2000 started to fall while the Dow moved into a trumpet formation, suggesting uncertainty. Is the Russell 2000 suggesting a collapse in the market? To answer this, you must look at the Russell index in Figure 2 and Figure 3. |

|
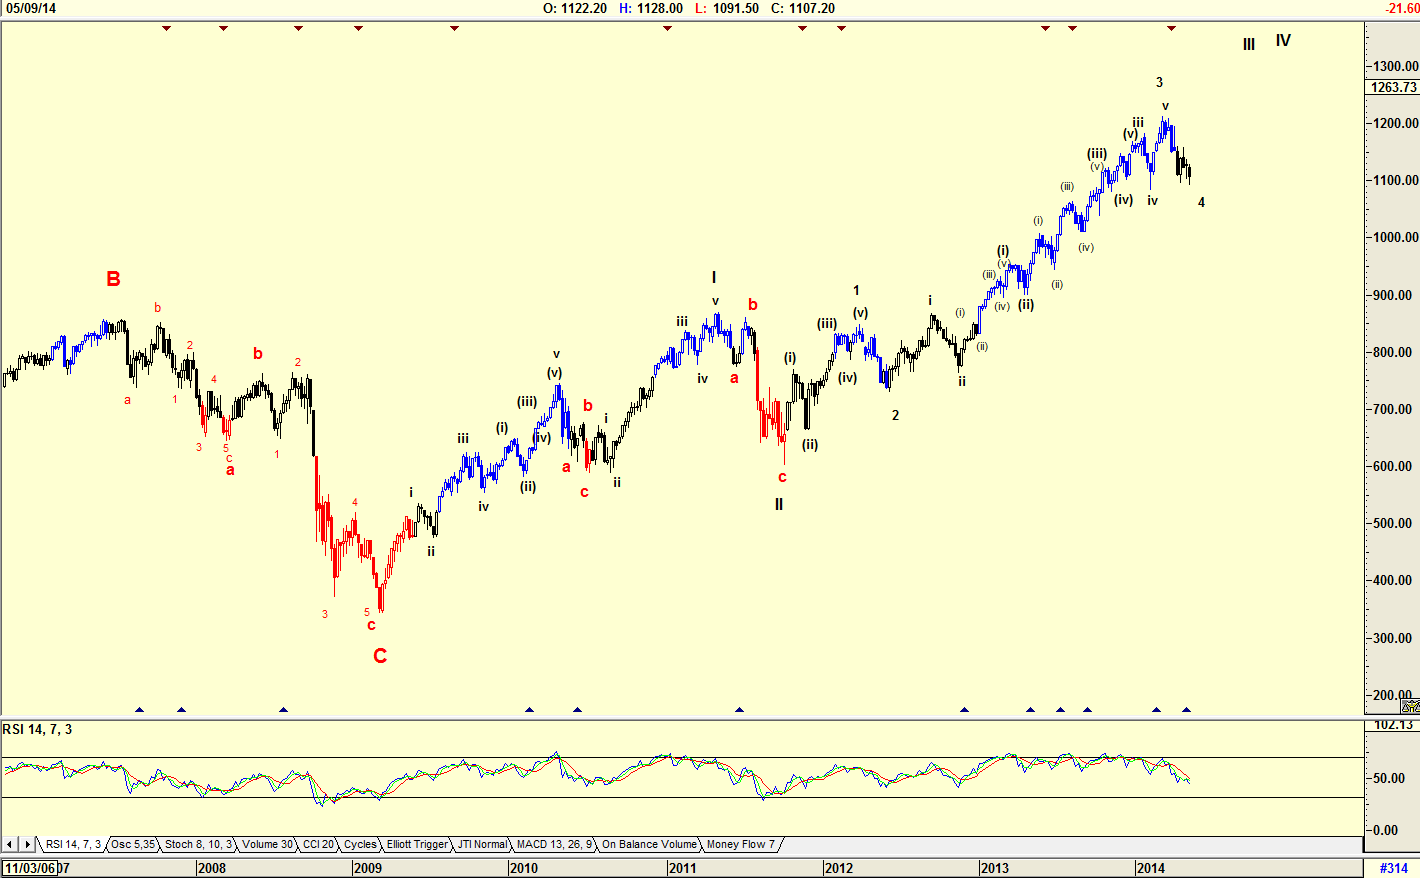
| Figure 2. Weekly chart of the Russell 2000 with Elliott wave count. |
| Graphic provided by: AdvancedGET. |
| |
| The chart in Figure 2 is a weekly chart with an Elliott wave count suggesting that the Russell 2000 index is completing a wave 4 of Wave III. The RSI index shown is suggesting that there is more downside and that wave 4 is not completed. |

|
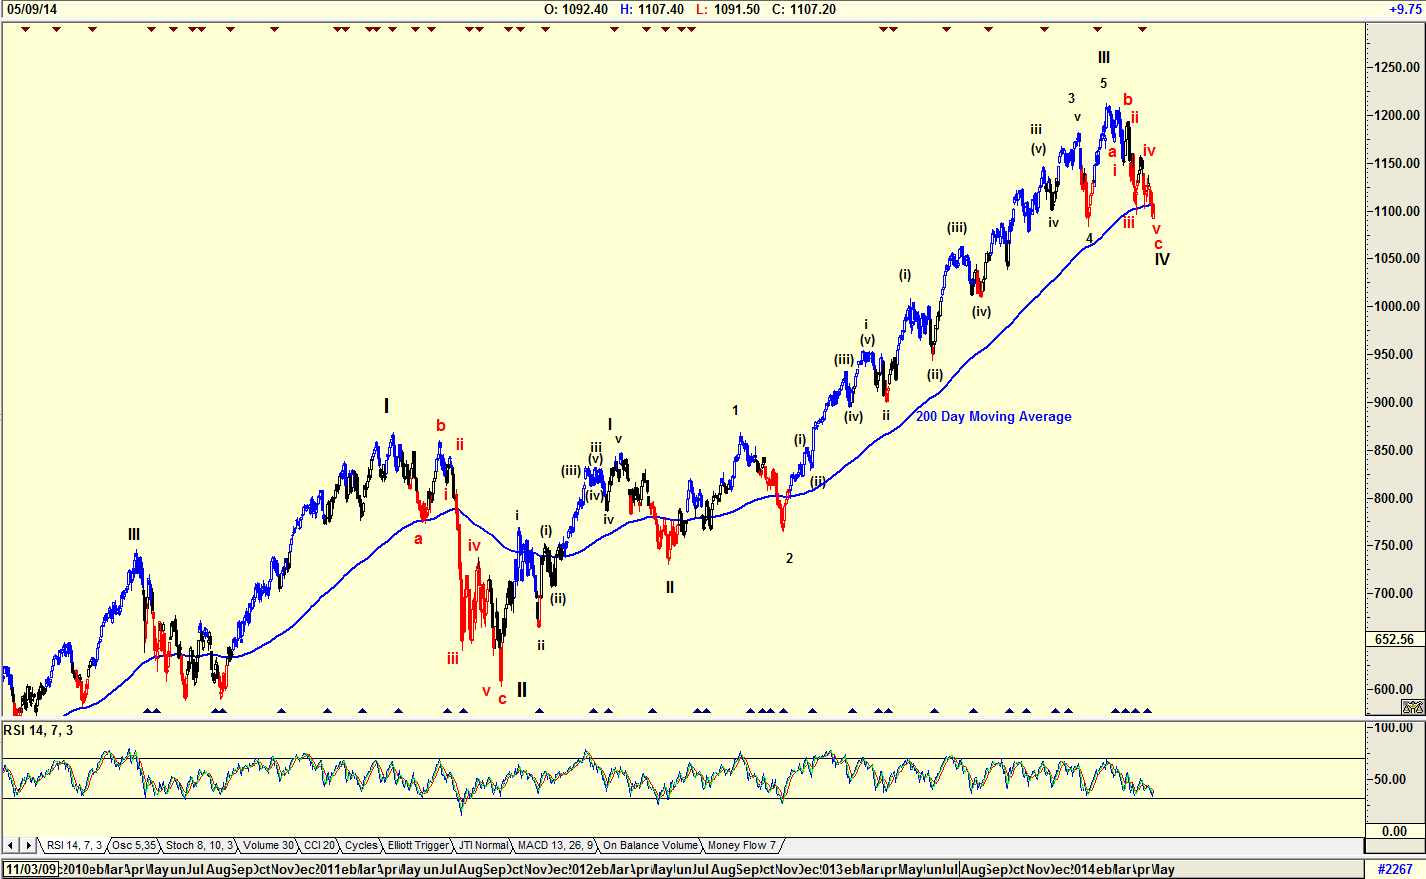
| Figure 3. Daily chart of the Russell 2000 Index with the 200-day moving average. |
| Graphic provided by: AdvancedGET. |
| |
| The chart in Figure 3 is a daily chart with an Elliott wave count showing the Wave IV of WAVE III correction that could be bottoming. This is because of the RSI index which is close to oversold levels and because of the penetration by the index of the 200-day moving average. Notice how in the past, once the 200-day moving average was penetrated, the index quickly reversed itself. The Russell 2000 index appears to be a leading index at the moment, in that it moved into a correction while the Dow played with uncertainty. Once the index starts correcting upwards, which the charts are suggesting could be within the month, the Dow will start moving upwards as will the market. You should however take note that the correction upwards will be in a Wave V of a WAVE III, suggesting that the WAVE IV correction that will follow could occur in the near future. Because WAVE II is a complicated wave as shown on the chart, WAVE IV should be a simple wave, short and quick and one that will hurt. However, knowing that the wave will be followed by an upward WAVE V, the correction, when it occurs, will present a buying opportunity. With Wave V of WAVE III coming soon, I would be a buyer of small cap shares. |
Has been a technical analyst since 1969, and has worked as a futures and options trader with First Financial Futures in Johannesburg, South Africa.
| Address: | 3256 West 24th Ave |
| Vancouver, BC | |
| Phone # for sales: | 6042634214 |
| E-mail address: | petroosp@gmail.com |
Click here for more information about our publications!
PRINT THIS ARTICLE

Request Information From Our Sponsors
- StockCharts.com, Inc.
- Candle Patterns
- Candlestick Charting Explained
- Intermarket Technical Analysis
- John Murphy on Chart Analysis
- John Murphy's Chart Pattern Recognition
- John Murphy's Market Message
- MurphyExplainsMarketAnalysis-Intermarket Analysis
- MurphyExplainsMarketAnalysis-Visual Analysis
- StockCharts.com
- Technical Analysis of the Financial Markets
- The Visual Investor
- VectorVest, Inc.
- Executive Premier Workshop
- One-Day Options Course
- OptionsPro
- Retirement Income Workshop
- Sure-Fire Trading Systems (VectorVest, Inc.)
- Trading as a Business Workshop
- VectorVest 7 EOD
- VectorVest 7 RealTime/IntraDay
- VectorVest AutoTester
- VectorVest Educational Services
- VectorVest OnLine
- VectorVest Options Analyzer
- VectorVest ProGraphics v6.0
- VectorVest ProTrader 7
- VectorVest RealTime Derby Tool
- VectorVest Simulator
- VectorVest Variator
- VectorVest Watchdog
