HOT TOPICS LIST
- MACD
- Fibonacci
- RSI
- Gann
- ADXR
- Stochastics
- Volume
- Triangles
- Futures
- Cycles
- Volatility
- ZIGZAG
- MESA
- Retracement
- Aroon
INDICATORS LIST
LIST OF TOPICS
PRINT THIS ARTICLE
by Donald W. Pendergast, Jr.
Google's 17% decline since late February 2014 may be about over - with a buying opportunity soon to appear.
Position: N/A
Donald W. Pendergast, Jr.
Freelance financial markets writer and online publisher of the Trendzetterz.com S&P 500 Weekly Forecast service.
PRINT THIS ARTICLE
SUPPORT & RESISTANCE
Google: Buying Opportunity?
05/13/14 04:11:27 PMby Donald W. Pendergast, Jr.
Google's 17% decline since late February 2014 may be about over - with a buying opportunity soon to appear.
Position: N/A
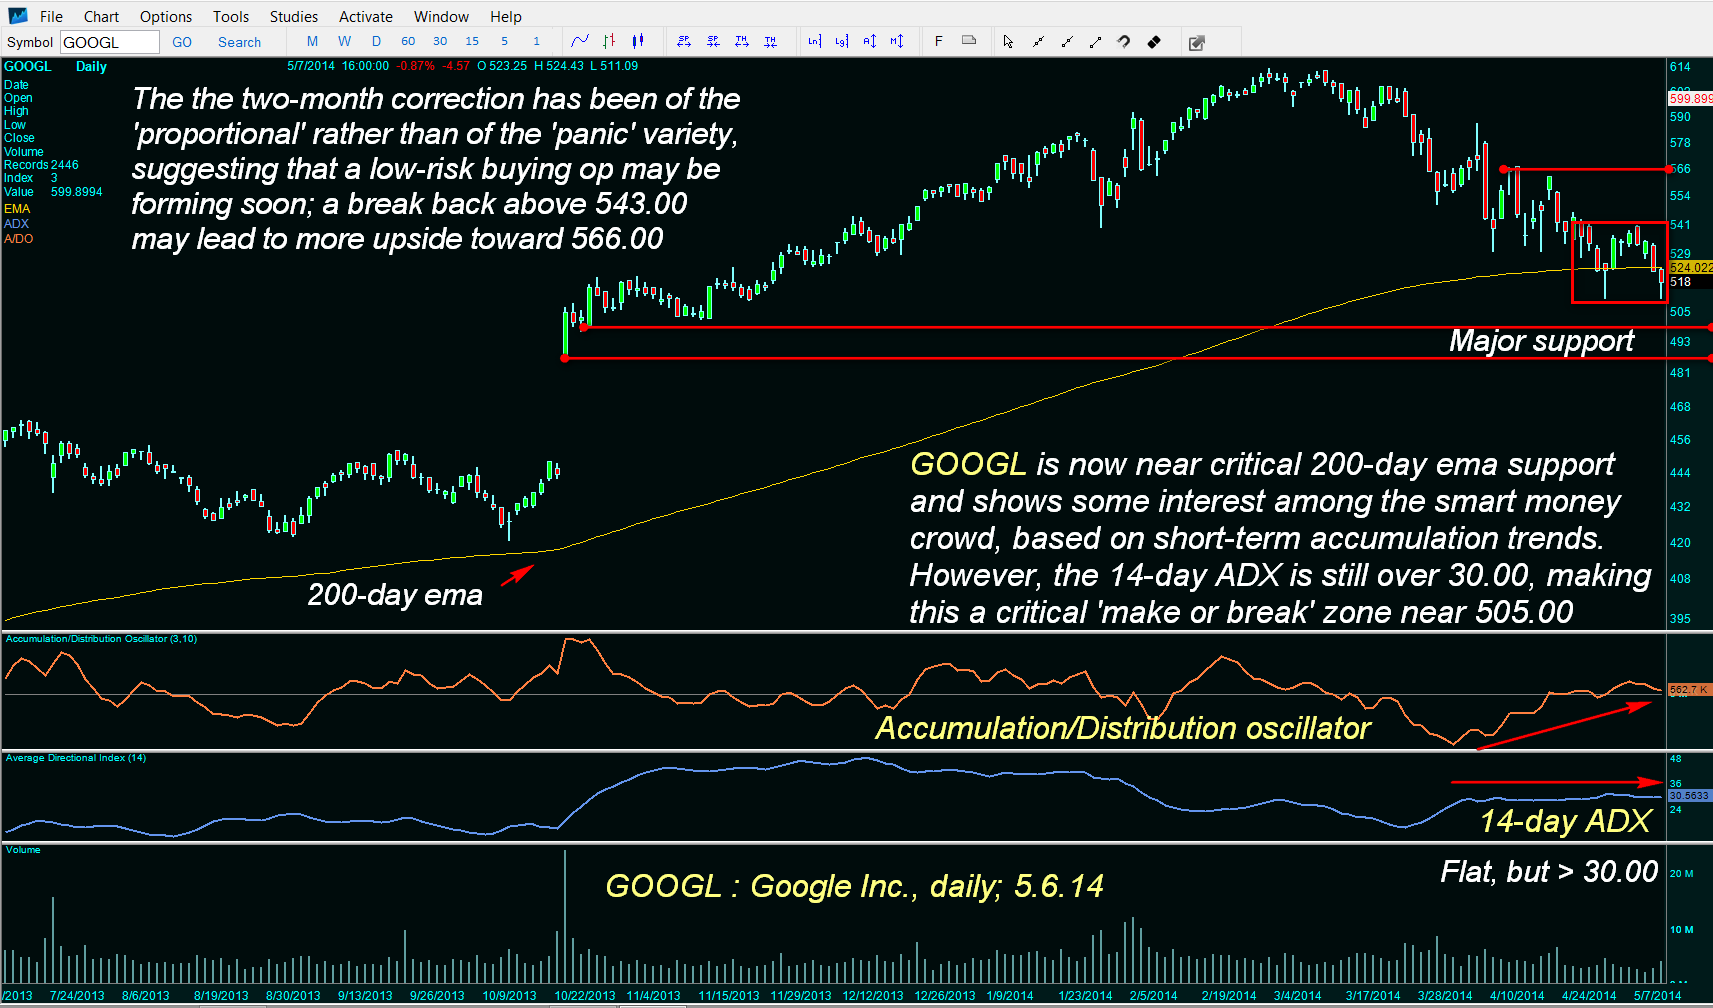
| After every big trending move appears the inevitable correction, one that may be a modest retracement before moving ever higher (lower) or, conversely, one that starts a major reversal leading to a strong trend in the opposite direction. The current sell-off in Google Inc. (GOOGL) is looking more and more like a mild correction against the existing trend rather than a shock sell-off leading to a major trend reversal. Here's a closer look (Figure 1). |

|
| Figure 1. Google Inc. (GOOGL) may be very close to staging a bullish reversal; the stock has been under accumulation for a month and downside momentum is stagnant as a major support test now unfolds. |
| Graphic provided by: InteliCharts. |
| |
| The performance of GOOGL since the major March 2009 lows has been quite good — up nearly five-fold by the time the all-time high of 614.44 was reached on February 26, 2014. The gains were especially good coming out of the June/November 2012 cycle lows, easily outperforming those seen in the Nasdaq 100 (.NDX) and S&P 500 (.SPX) indexes. To say that GOOGL is in a long-term uptrend would be an understatement. Still, this stock corrects back to meaningful support just like any other and the steady but slow bleed-off seen since late February 2014 is now in the midst of its second test of major support at the 200-day exponential moving average (EMA). Several bullish factors suggest the line of least resistance for GOOGL is higher: 1. The long candle shadows that have now dipped twice below the 200-day EMA imply strong demand near 510.00. 2. The accumulation/distribution oscillator shows steady demand for the stock on the approach toward EMA support. 3. The 14-day ADX (average directional movement index), although still above 30.00, has been moving sideways for the past month. 4. Trading volume shows no sign at all of a major panic during the correction. |

|
| Figure 2. GOOGL has been underperforming the .SPX lately; note that the stock is somewhat non-correlated to the .SPX. |
| Graphic provided by: TradeStation. |
| Graphic provided by: TradeStation RadarScreen. |
| |
| Taken as a whole, what we see here in GOOGL is a large cap issue that appears to be on the radar of the "smart money" crowd for a near-term rally. Going short here would not be a wise idea — look to see how far up GOOGL rallies first and then reassess the technicals to see if you can time a low-risk short. In the meantime, be on the lookout for a big volume, daily bullish reversal candle as the "all clear" signal for bulls to get back on board for a tradable swing move back up toward the 545.00 to 566.00 level in the next couple of weeks. You may choose to play this as a stock-only swing trade (using a 60-minute chart to fine-tune your entry) or to get really creative and sell a near term out-of-the-money (OTM) put option at a 500.00 strike price. For a skilled put seller, this could be a great setup, provided you get that initial bullish pop to get the momentum squarely in favor of a rally. Keep your account risk at 1 to 2% maximum and remember to trade wisely until we meet here again. |
Freelance financial markets writer and online publisher of the Trendzetterz.com S&P 500 Weekly Forecast service.
| Title: | Market consultant and writer |
| Company: | Trendzetterz |
| Address: | 81 Hickory Hollow Drive |
| Crossville, TN 38555 | |
| Phone # for sales: | 904-303-4814 |
| Website: | trendzetterz.com |
| E-mail address: | support@trendzetterz.com |
Traders' Resource Links | |
| Trendzetterz has not added any product or service information to TRADERS' RESOURCE. | |
Click here for more information about our publications!
Comments
Date: 05/15/14Rank: 5Comment:

|

Request Information From Our Sponsors
- StockCharts.com, Inc.
- Candle Patterns
- Candlestick Charting Explained
- Intermarket Technical Analysis
- John Murphy on Chart Analysis
- John Murphy's Chart Pattern Recognition
- John Murphy's Market Message
- MurphyExplainsMarketAnalysis-Intermarket Analysis
- MurphyExplainsMarketAnalysis-Visual Analysis
- StockCharts.com
- Technical Analysis of the Financial Markets
- The Visual Investor
- VectorVest, Inc.
- Executive Premier Workshop
- One-Day Options Course
- OptionsPro
- Retirement Income Workshop
- Sure-Fire Trading Systems (VectorVest, Inc.)
- Trading as a Business Workshop
- VectorVest 7 EOD
- VectorVest 7 RealTime/IntraDay
- VectorVest AutoTester
- VectorVest Educational Services
- VectorVest OnLine
- VectorVest Options Analyzer
- VectorVest ProGraphics v6.0
- VectorVest ProTrader 7
- VectorVest RealTime Derby Tool
- VectorVest Simulator
- VectorVest Variator
- VectorVest Watchdog
