HOT TOPICS LIST
- MACD
- Fibonacci
- RSI
- Gann
- ADXR
- Stochastics
- Volume
- Triangles
- Futures
- Cycles
- Volatility
- ZIGZAG
- MESA
- Retracement
- Aroon
INDICATORS LIST
LIST OF TOPICS
PRINT THIS ARTICLE
by Koos van der Merwe
Amazon has grown and grown and grown, but is the company reaching its limit?
Position: Hold
Koos van der Merwe
Has been a technical analyst since 1969, and has worked as a futures and options trader with First Financial Futures in Johannesburg, South Africa.
PRINT THIS ARTICLE
RSI
Another Look At Amazon
05/13/14 04:07:01 PMby Koos van der Merwe
Amazon has grown and grown and grown, but is the company reaching its limit?
Position: Hold
| When you look at analyst forecasts for Amazon (AMZN) you meet a great deal of negativity. The Motley Fool Guru Analysis for AMZN's report card has six passes and ten failures with one neutral. Based on this analysis, would you be a buyer for a long term hold of AMZN? Technical analysis teaches you to buy when everyone is selling, so, is it time to start buying shares of AMZN? |

|
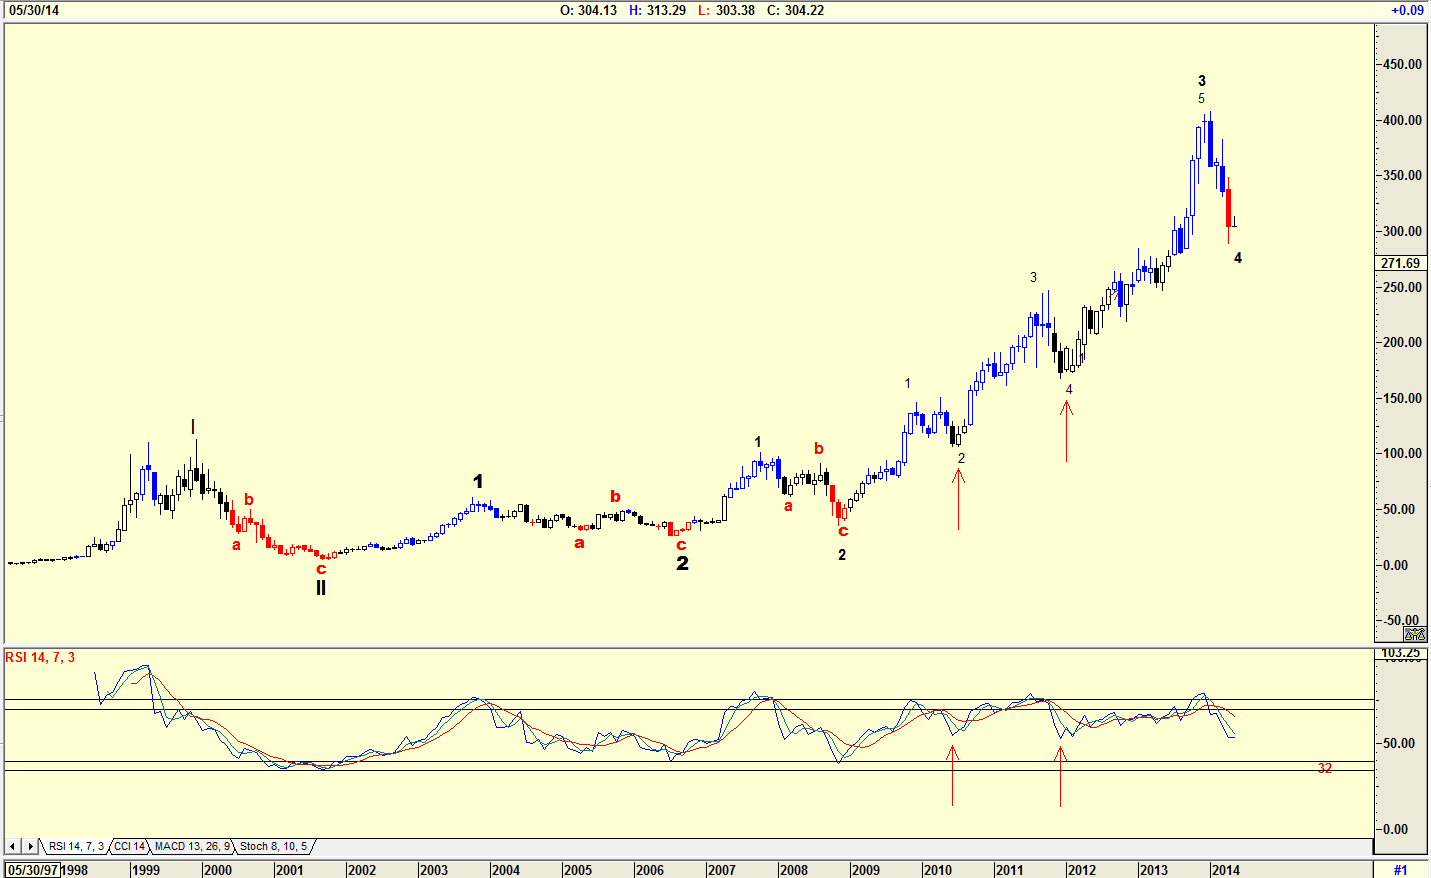
| Figure 1. Monthly chart with Elliott Wave count |
| Graphic provided by: AdvancedGET. |
| |
| The chart in Figure 1 is a monthly chart of AMZN with an Elliott wave count suggesting that the share price is tracing a wave 4 of Wave 3 of WAVE III. The Elliott rule is that a wave 4 will be a simple wave if wave 2 is a complicated wave and vice versa. Wave 2 was an abc correction, so wave 4 could either be a simple correction and start bottoming, or a complicated correction with a b-wave up move followed by a complicated c-wave down. The RSI indicator suggests the latter is indeed possible because at 49.71 it is nowhere near the buy level of 32. However, looking back over previous RSI signals, you can see where the stock price moved higher without the RSI indicator reaching the buy zone. I must add that the chart does obey the first rule of Elliott wave theory, namely, "the chart must look correct." |

|
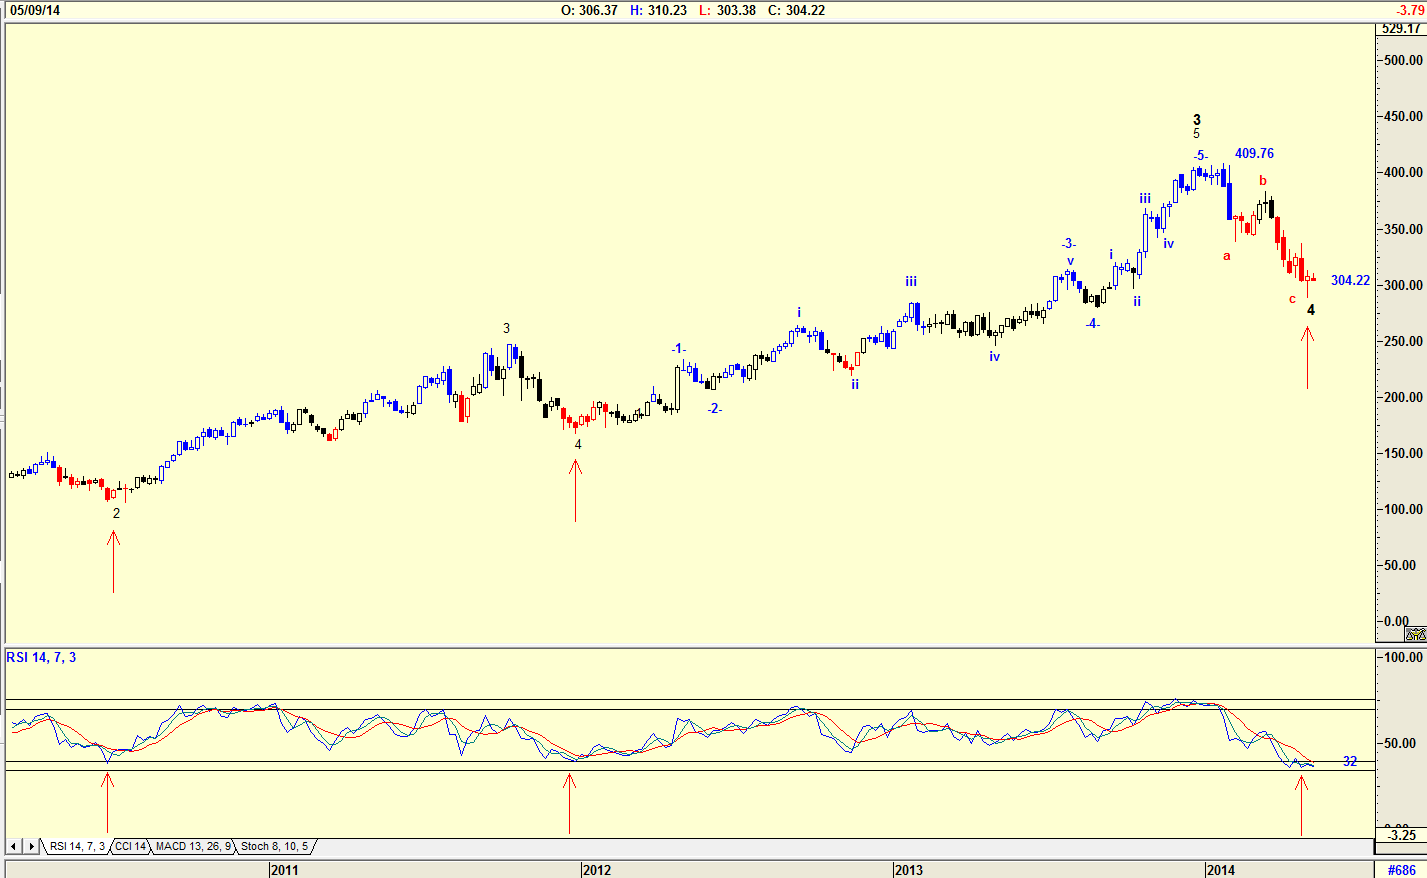
| Figure 2 Weekly chart showing RSI signals. |
| Graphic provided by: AdvancedGET. |
| |
| A weekly chart, on the other hand as shown in Figure 2 shows the RSI falling close to the 32 level, the buy level. The wave 4 shown on the chart has an RSI suggesting a buy. The Wave 5 should be higher than $409.76, the wave 5 of Wave 5 of WAVE 3 high. With the current price of the share at $304.22 this is a $105.54 rise, (34.69%). |

|
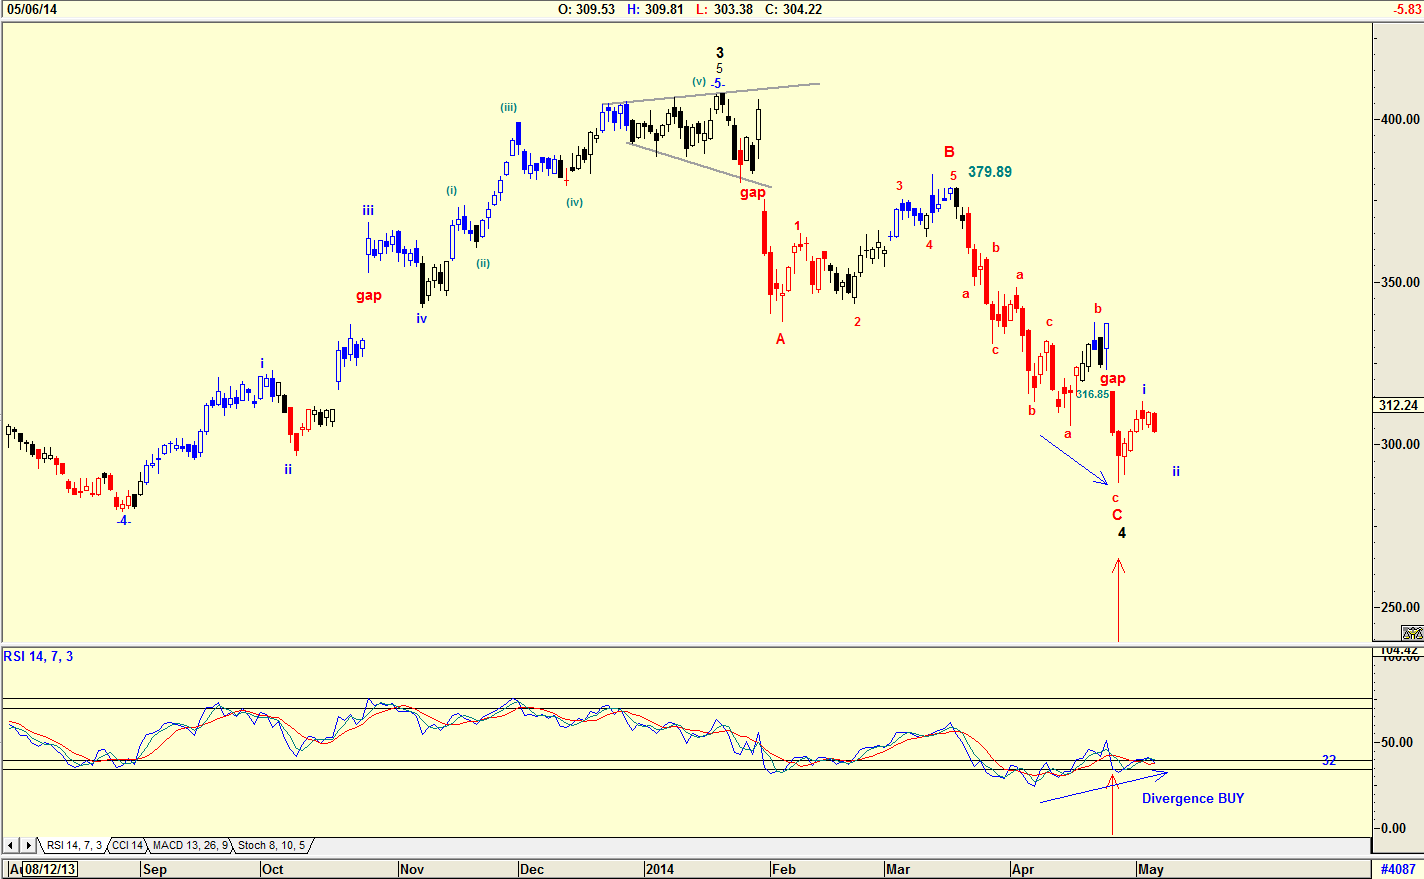
| Figure 3 Daily chart showing a divergence BUY signal. |
| Graphic provided by: AdvancedGET. |
| |
| The chart in Figure 3 is a daily chart showing an RSI divergence buy signal. The Elliott wave count is suggesting that the share price could be in a wave ii of WAVE 5. The share price should also rise to fill the small gap at $316.85. |

|
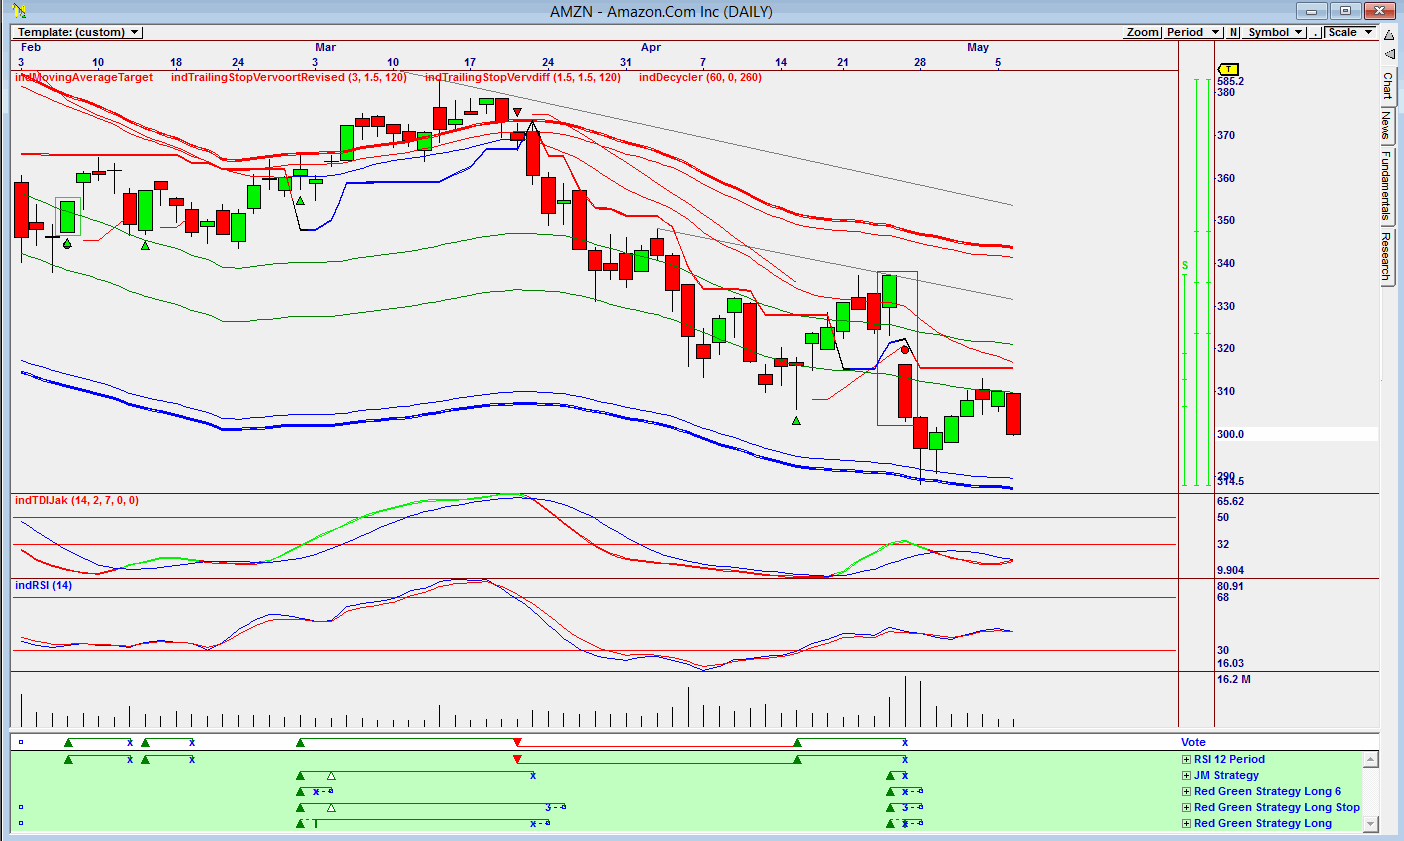
| Figure 4. Omnitrader chart with vote line not showing a BUY. |
| Graphic provided by: Omnitrader.. |
| |
| Buying a share when everyone is selling takes courage. The RSI indicator and the Elliott wave count are both suggesting that AMZN is at buy levels or close to it. The Omnitrader chart in Figure 4 has a vote line that is not showing a buy. I would therefore wait and buy when the strategies shown below the vote line start suggesting a buy. It is always better to buy a share as it rises rather than as it is falling. AMZN is a share definitely on my watch list for a long term buy and hold. |
Has been a technical analyst since 1969, and has worked as a futures and options trader with First Financial Futures in Johannesburg, South Africa.
| Address: | 3256 West 24th Ave |
| Vancouver, BC | |
| Phone # for sales: | 6042634214 |
| E-mail address: | petroosp@gmail.com |
Click here for more information about our publications!
Comments
Date: 05/15/14Rank: 3Comment: I am an Elliott wave analyst. I object to writers saying The ..count is , when what they mean is My analysis is that the most probable Elliott count is , or My count is for short. To claim that they know The count is foolish arrogance, which is what gives Elliott wave analysis a bad name.

Request Information From Our Sponsors
- StockCharts.com, Inc.
- Candle Patterns
- Candlestick Charting Explained
- Intermarket Technical Analysis
- John Murphy on Chart Analysis
- John Murphy's Chart Pattern Recognition
- John Murphy's Market Message
- MurphyExplainsMarketAnalysis-Intermarket Analysis
- MurphyExplainsMarketAnalysis-Visual Analysis
- StockCharts.com
- Technical Analysis of the Financial Markets
- The Visual Investor
- VectorVest, Inc.
- Executive Premier Workshop
- One-Day Options Course
- OptionsPro
- Retirement Income Workshop
- Sure-Fire Trading Systems (VectorVest, Inc.)
- Trading as a Business Workshop
- VectorVest 7 EOD
- VectorVest 7 RealTime/IntraDay
- VectorVest AutoTester
- VectorVest Educational Services
- VectorVest OnLine
- VectorVest Options Analyzer
- VectorVest ProGraphics v6.0
- VectorVest ProTrader 7
- VectorVest RealTime Derby Tool
- VectorVest Simulator
- VectorVest Variator
- VectorVest Watchdog
