

HOT TOPICS LIST
- MACD
- Fibonacci
- RSI
- Gann
- ADXR
- Stochastics
- Volume
- Triangles
- Futures
- Cycles
- Volatility
- ZIGZAG
- MESA
- Retracement
- Aroon
INDICATORS LIST
LIST OF TOPICS
PRINT THIS ARTICLE
by Donald W. Pendergast, Jr.
With the powerful late 2013/early 2014 rally in Tyson Foods 'A' shares now history, how far down will the bears take this stock?
Position: N/A
Donald W. Pendergast, Jr.
Freelance financial markets writer and online publisher of the Trendzetterz.com S&P 500 Weekly Forecast service.
PRINT THIS ARTICLE
REVERSAL
TSN: Bearish Trend Reversal
05/12/14 04:09:50 PMby Donald W. Pendergast, Jr.
With the powerful late 2013/early 2014 rally in Tyson Foods 'A' shares now history, how far down will the bears take this stock?
Position: N/A
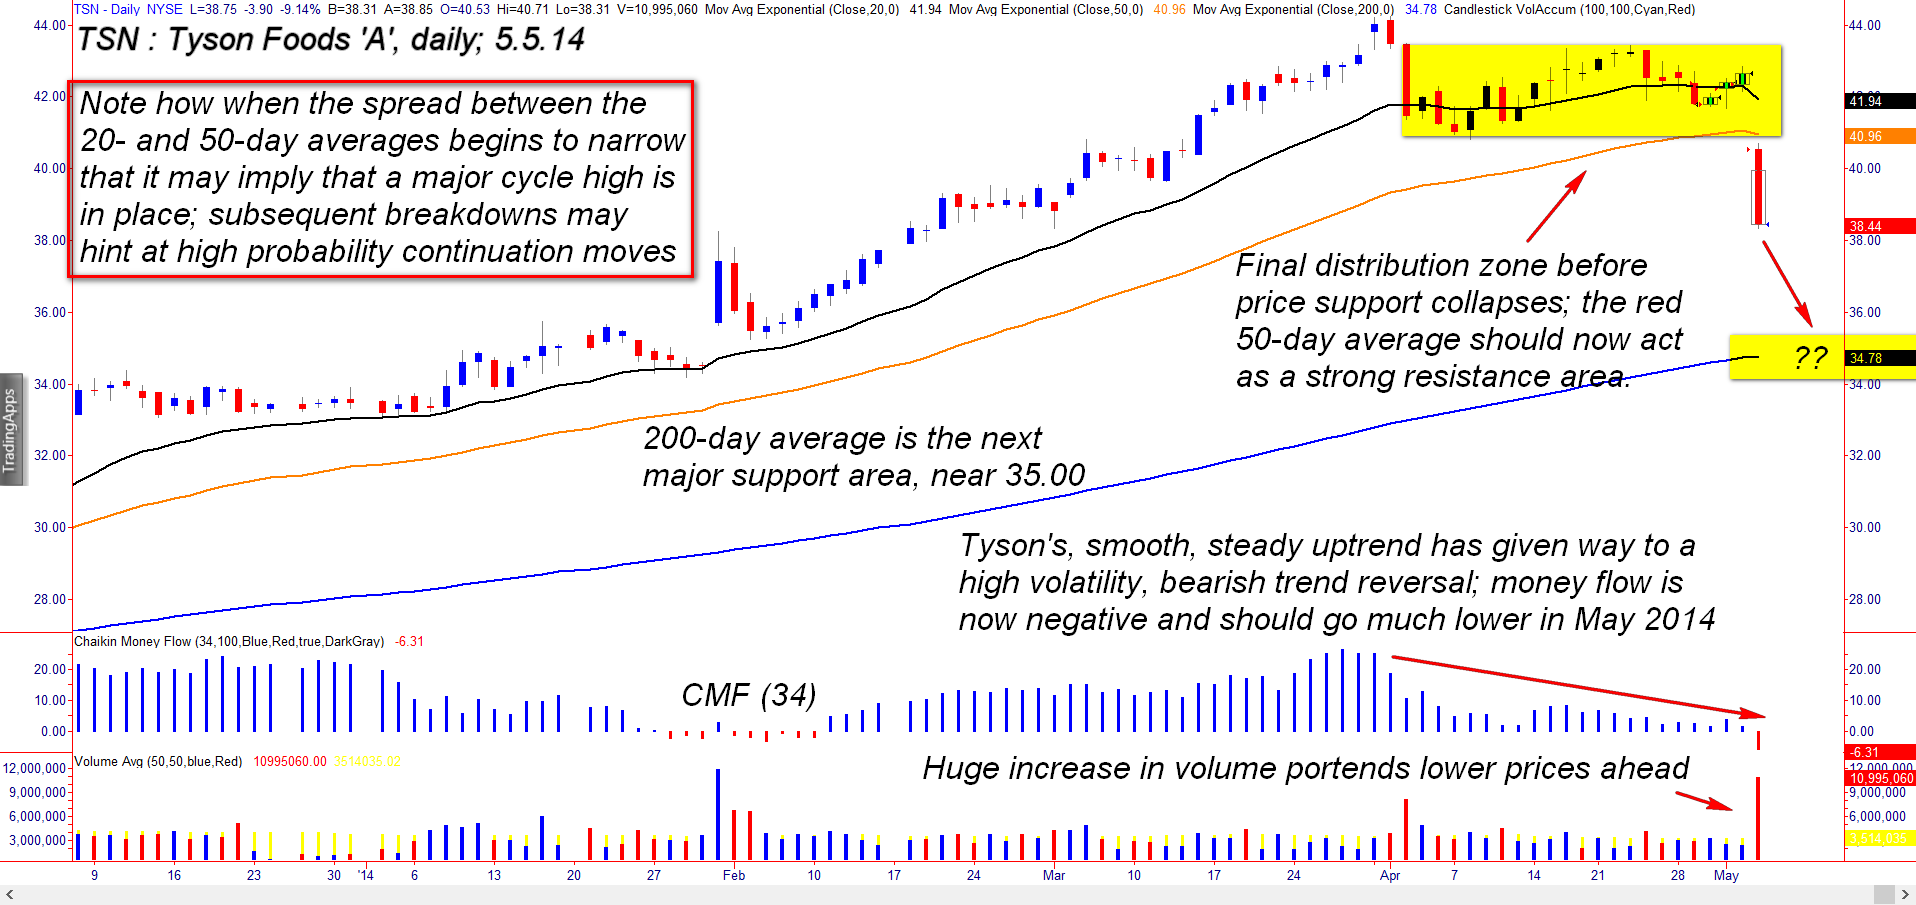
| Over the past two months, the volatility in many former high-flying stocks has increased noticeably; some are already in strong downtrends while others are still in final distribution phases before more selling kicks in. Tyson Foods 'A' shares (TSN) are part of the market that has already gone into a confirmed bearish reversal, one that may continue to play out for months to come. Here's a closer look at TSN's daily chart (Figure 1). |
|
| Figure 1. Tyson Foods 'A' (TSN) is now clearly in a bearish trend reversal; note the month-long distribution before the bottom fell out. |
| Graphic provided by: TradeStation. |
| |
| Trend following is one of the easiest types of trading for newer traders to comprehend, but to learn to stay with such trends with real money on the line takes a lot of mental and emotional discipline. Traders who saw the nascent bullish breakout in TSN in November 2013 and then waited for the weekly chart ADX to start moving higher (indicating a strong trend) were offered an outstanding opportunity to get on board this powerful momentum move in late November 2013; the weekly ADX rose every week thereafter until just after the early April 2014 high at 44.24. No need to determine 'overbought/oversold' or other technical extremes here — just a patient, multimonth commitment to a developing trend in an S&P 500 component issue with solid fundamentals. If you are a newer trader looking for a common sense way to learn to trade trends, always trade in line with the weekly ADX on liquid stocks with bullish fundamentals; but only on the long side, as the short side of the market can be difficult to trade and is far more unforgiving and volatile in many cases. Okay, that was then, this is now; how do we trade TSN here, seeing that the following is in place: 1. After the final distribution zone completed, the bears took control, gapping TYN down on huge daily volume. 2. The narrowing spread between the two- and 50-day averages suggests that a major cycle high is already in place. 3. The 34-day Chaikin Money flow histogram (CMF)(34) has just gone negative for the first time in 14 weeks. 4. The logical daily target price is near 35.00 (200-day average) and the weekly chart target is closer to 34.00 (50-week average). The technical bias is toward the downside over the next month or two; daily chart traders may want to wait for a minor pullback toward the 50-day average and then look to enter short on subsequent weakness with half a position. On a possible break below 38.31, you may wish to add more to your short in anticipation of more downside to the 35.00 support level. For what it's worth, I have learned that shorting breakdowns is more risky than shorting pullbacks (in a strong downtrend), so perhaps this bit of hard-won wisdom can benefit your trading too. Interestingly, the late afternoon selling pressure in TSN dried up going into the close on Monday's (May 5, 2014) session, so be looking for a bit of a pullback. |
|
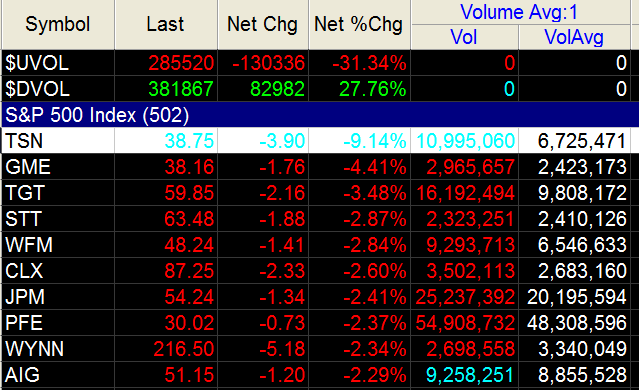
| Figure 2. Scanning for stocks that have large percentage declines can help you find issues that have finally confirmed major trend reversals. |
| Graphic provided by: TradeStation. |
| Graphic provided by: TradeStation RadarScreen. |
| |
| Trading the short side of a stock that has just gone into a bearish reversal can be profitable, but you need to be nimble to avoid getting trapped in short squeezes and sudden bullish reversals. You also need to avoid shorting stocks at the time they pay dividends to shareholders because you will be the one who owes the dividend! That aside, shorting TSN looks fairly low-risk, should the above setup appear in the next week or so. Trade wisely until we meet here again. |
Freelance financial markets writer and online publisher of the Trendzetterz.com S&P 500 Weekly Forecast service.
| Title: | Market consultant and writer |
| Company: | Trendzetterz |
| Address: | 81 Hickory Hollow Drive |
| Crossville, TN 38555 | |
| Phone # for sales: | 904-303-4814 |
| Website: | trendzetterz.com |
| E-mail address: | support@trendzetterz.com |
Traders' Resource Links | |
| Trendzetterz has not added any product or service information to TRADERS' RESOURCE. | |
Click here for more information about our publications!
PRINT THIS ARTICLE

Request Information From Our Sponsors
- StockCharts.com, Inc.
- Candle Patterns
- Candlestick Charting Explained
- Intermarket Technical Analysis
- John Murphy on Chart Analysis
- John Murphy's Chart Pattern Recognition
- John Murphy's Market Message
- MurphyExplainsMarketAnalysis-Intermarket Analysis
- MurphyExplainsMarketAnalysis-Visual Analysis
- StockCharts.com
- Technical Analysis of the Financial Markets
- The Visual Investor
- VectorVest, Inc.
- Executive Premier Workshop
- One-Day Options Course
- OptionsPro
- Retirement Income Workshop
- Sure-Fire Trading Systems (VectorVest, Inc.)
- Trading as a Business Workshop
- VectorVest 7 EOD
- VectorVest 7 RealTime/IntraDay
- VectorVest AutoTester
- VectorVest Educational Services
- VectorVest OnLine
- VectorVest Options Analyzer
- VectorVest ProGraphics v6.0
- VectorVest ProTrader 7
- VectorVest RealTime Derby Tool
- VectorVest Simulator
- VectorVest Variator
- VectorVest Watchdog