

HOT TOPICS LIST
- MACD
- Fibonacci
- RSI
- Gann
- ADXR
- Stochastics
- Volume
- Triangles
- Futures
- Cycles
- Volatility
- ZIGZAG
- MESA
- Retracement
- Aroon
INDICATORS LIST
LIST OF TOPICS
PRINT THIS ARTICLE
by Donald W. Pendergast, Jr.
Newfield Exploration's latest bullish breakout offers swing traders an attractive opportunity.
Position: N/A
Donald W. Pendergast, Jr.
Freelance financial markets writer and online publisher of the Trendzetterz.com S&P 500 Weekly Forecast service.
PRINT THIS ARTICLE
CHART ANALYSIS
NFX: Powerful Follow Through
05/09/14 02:53:10 PMby Donald W. Pendergast, Jr.
Newfield Exploration's latest bullish breakout offers swing traders an attractive opportunity.
Position: N/A
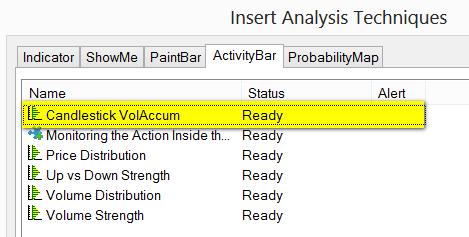
| Some of the most powerful and useful tools within the TradeStation platform can be found under the 'show me', 'paint bar', and 'activity bar' tabs. Here's a look at an extremely effective volume accumulation identifier that can frequently appear just before a bullish continuation move, particularly from key support levels on stocks and exchange traded funds (ETFs). |
|
| Figure 1. In the TradeStaion 9.1 platform, you can find the study used in this article by clicking 'Insert/Activity Bar/Candlestick Vol Accum.' |
| Graphic provided by: TradeStation. |
| |
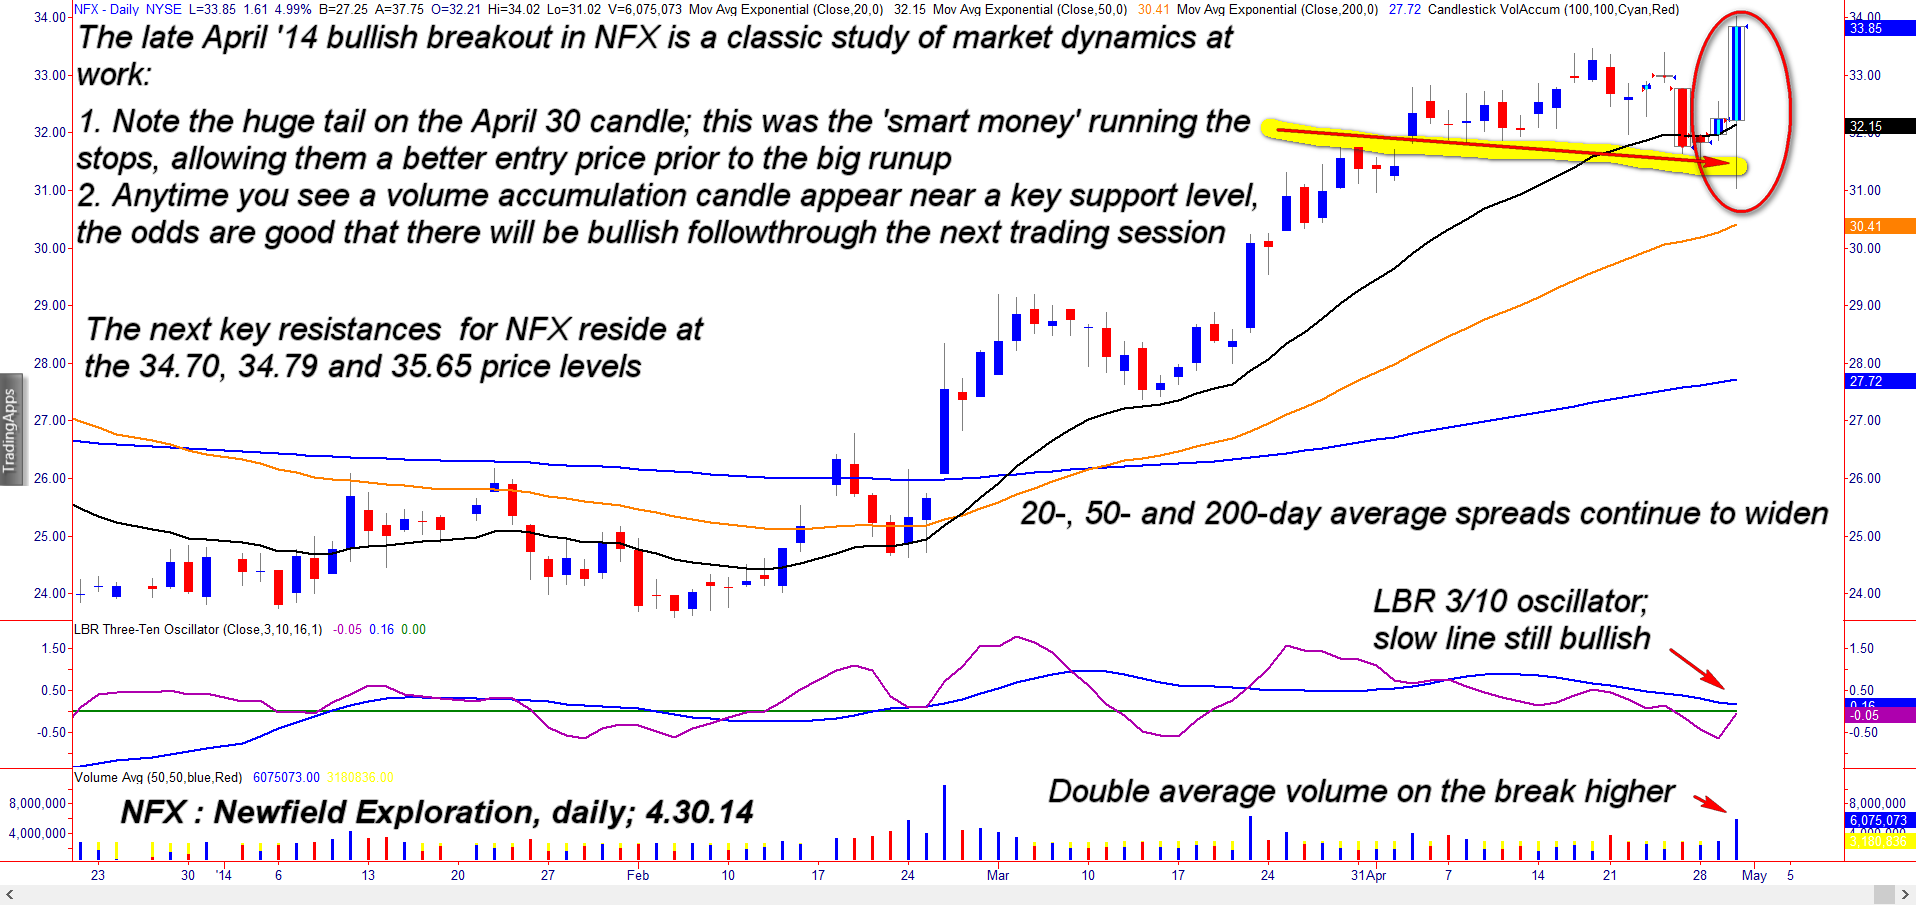
| By now, you are getting a handle on the all-important concept of the everyday market war waged by the "smart money" against the "dumb money" (deep pockets pro traders/institutions against the little guy retail trader) and how it always pays to trade in the anticipated direction that the big money powers appear to be taking the market. These big players account for about 80% of all trading volume in US stocks and ETFs and are the primary force that initiates all significant swing/trending moves in virtually all stocks. One way to easily identify where the smart money is likely to be interested in pushing a stock higher is to monitor for the appearance of a 'Candlestick VolAccum' price bar under the 'Activity Bar' tab found in TradeStation. Two such bars have already printed on the daily chart for Newfield Exploration (NFX), with powerful bullish follow through (Figure 2): 1. The first accumulation bar (they are a bright aqua color for easy visual ID) appeared on April 29, 2014 and was of only modest range. However, it was part of a larger pullback pattern, one that found tentative support near the 20-day exponential moving average (EMA). 2. As that bar printed, all three key EMAs (20-, 50- and 200-day) were rising and the spreads between them were also increasing. 3. NFX also featured superb relative strength vs. the S&P 500 index (.SPX) over the prior 13 weeks, something that the smart money always likes to see before plopping down millions of dollars at the start of a fresh stock accumulation program. |
|
| Figure 2. The so-called "smart money" initiates all tradable moves in the stock market, and it appears they really like the idea of being long NFX right about now. |
| Graphic provided by: TradeStation. |
| |
| Well, the smart money made their move alright, and here's how they did it — at the start of the session on April 30 2014, they pulled NFX down at the open, running the long sell stops of recent longs, causing them to sell; this allowed the big money boys a better entry price for NFX and once the stops were cleaned out, they began buying aggressively, pushing the stock up by 4.99% on the session. Yes, Candlestick VolAccumulation bars have great predictive power of bullish follow through, especially if items 1, 2, and 3 above are all present. There are important lessons for new traders regarding the proper engagement of this particular candle setup: 1. Never, ever buy at the open, especially with a market order; instead, wait for verification that the high of the previous candle volume accumulation bar has been exceeded by a few ticks before going long. Traders who patiently waited for Wednesday's high of 32.54 to be exceeded were completely insulated from the early morning stop gunning exercise and then had a great opportunity to stay with the trade throughout the session. 2. Only buy stocks in strong up trends (higher highs/higher lows and widening moving average spreads). 3. Only buy those that have strong four- or 13- week relative strength against the .SPX. 4. Only enter after a key support area has been tested. 5. If time allows, do research on the stock's fundamentals to check on its earnings growth potential, sales growth, and overall financial condition. |
| By focusing your trading energy on seeking stocks (liquid stocks, not penny stock garbage) with these essential characteristics — once you've located those with a new Candle VolAccumulation activity bar — you should see your trading performance increase by a remarkable level. Trade wisely until we meet here again. |
Freelance financial markets writer and online publisher of the Trendzetterz.com S&P 500 Weekly Forecast service.
| Title: | Market consultant and writer |
| Company: | Trendzetterz |
| Address: | 81 Hickory Hollow Drive |
| Crossville, TN 38555 | |
| Phone # for sales: | 904-303-4814 |
| Website: | trendzetterz.com |
| E-mail address: | support@trendzetterz.com |
Traders' Resource Links | |
| Trendzetterz has not added any product or service information to TRADERS' RESOURCE. | |
Click here for more information about our publications!
PRINT THIS ARTICLE

Request Information From Our Sponsors
- StockCharts.com, Inc.
- Candle Patterns
- Candlestick Charting Explained
- Intermarket Technical Analysis
- John Murphy on Chart Analysis
- John Murphy's Chart Pattern Recognition
- John Murphy's Market Message
- MurphyExplainsMarketAnalysis-Intermarket Analysis
- MurphyExplainsMarketAnalysis-Visual Analysis
- StockCharts.com
- Technical Analysis of the Financial Markets
- The Visual Investor
- VectorVest, Inc.
- Executive Premier Workshop
- One-Day Options Course
- OptionsPro
- Retirement Income Workshop
- Sure-Fire Trading Systems (VectorVest, Inc.)
- Trading as a Business Workshop
- VectorVest 7 EOD
- VectorVest 7 RealTime/IntraDay
- VectorVest AutoTester
- VectorVest Educational Services
- VectorVest OnLine
- VectorVest Options Analyzer
- VectorVest ProGraphics v6.0
- VectorVest ProTrader 7
- VectorVest RealTime Derby Tool
- VectorVest Simulator
- VectorVest Variator
- VectorVest Watchdog