HOT TOPICS LIST
- MACD
- Fibonacci
- RSI
- Gann
- ADXR
- Stochastics
- Volume
- Triangles
- Futures
- Cycles
- Volatility
- ZIGZAG
- MESA
- Retracement
- Aroon
INDICATORS LIST
LIST OF TOPICS
PRINT THIS ARTICLE
by Matt Blackman
After bottoming in 2009 Adobe soared more than 400% to its March 2014 peak just shy of $70. But its best days may be behind it based on what the technicals and fundamentals are saying.
Position: N/A
Matt Blackman
Matt Blackman is a full-time technical and financial writer and trader. He produces corporate and financial newsletters, and assists clients in getting published in the mainstream media. He is the host of TradeSystemGuru.com. Matt has earned the Chartered Market Technician (CMT) designation. Find out what stocks and futures Matt is watching on Twitter at www.twitter.com/RatioTrade
PRINT THIS ARTICLE
DECLINING TREND
Adobe - Is The Acrobat Tiring?
05/07/14 02:41:44 PMby Matt Blackman
After bottoming in 2009 Adobe soared more than 400% to its March 2014 peak just shy of $70. But its best days may be behind it based on what the technicals and fundamentals are saying.
Position: N/A
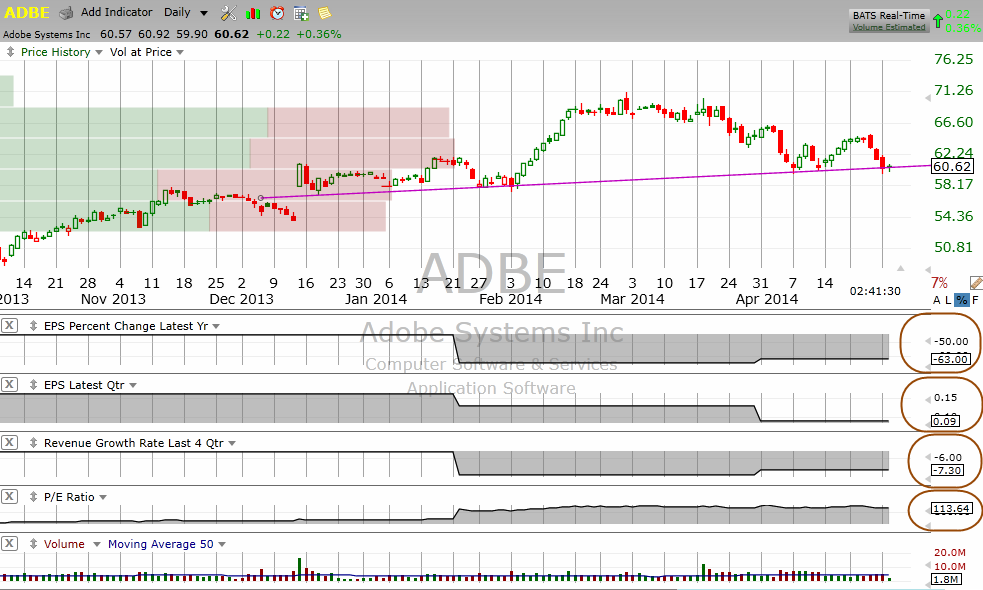
| When a stock is in favor, it can take time before deteriorating revenues and earnings begin to sink in to investors' combined psyches. To see this in action, you need look no further than software application company Adobe Systems Inc. (ADBE). As you see in Figure 1, ADBE has struggled since hitting an all-time post-split high in March 2014. Despite steadily declining revenues and earnings over the last three years, investors have continued to bid the stock higher and in the process pushed the price-earnings ratio into three digit territory. |

|
| Figure 1. Daily chart showing the ADBE chart with fundamentals. Note the steady decline of the latter. |
| Graphic provided by: TC2000.com. |
| |
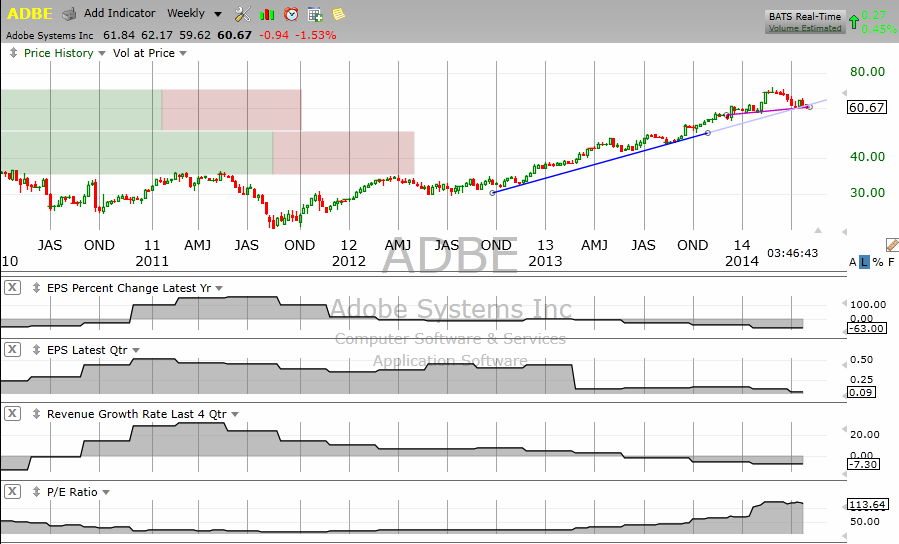
| Annual earnings per share have declined 63% as of the most recent data and revenues have declined 7.3% in the last four quarters pushing the PE ratio up to 114 in the process. This means that investors are prepared to pay $114 for every $1 of earnings. In other words, they are happy to earn a paltry 0.008% on their money. A look at the weekly chart in Figure 2 shows that revenue and earnings growth has been declining since early 2011 over which time the stock price has doubled. You get a sense of just how expensive ADBE has become when you compare it to another software application company, Oracle Corporation (ORCL) with a PE of less than 17. |

|
| Figure 2. Weekly chart of Adobe Systems Inc. showing the longer-term technical and fundamental picture. |
| Graphic provided by: TC2000.com. |
| |
| That hope for a turnaround has finally hit reality head on and became technically evident with the appearance of a bearish head & shoulders (H&S) chart pattern with an upward sloping neckline around $60 in Figure 1. Furthermore ADBE has also recently broken 18-month uptrend support. |

|
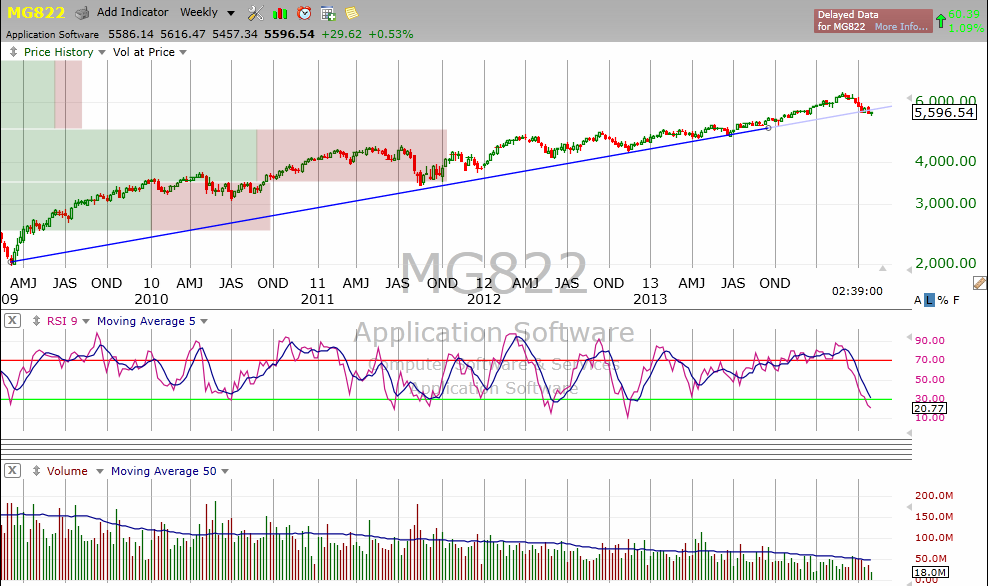
| Figure 3. Weekly chart of the application software industry showing an overall peak and recent decline. |
| Graphic provided by: TC2000.com. |
| |
| As Figure 3 shows, the application software space also looks to have entered a correction phase dropping 12.5% from its late February 2014 peak. |
| There is clearly a growing disconnect between earnings reality and investor hope. How much could ADBE drop? It would have to drop below $10 for its PE to equal the valuation of ORCL. A more realistic forecast based on the H&S pattern suggests a minimum projected target for ADBE of $49 by taking the distance from the neckline to the top of the head and subtracting that from the recent neckline position (assuming the H&S pattern is confirmed with a decisive breach of the neckline). This is also close to the nearest level of historic support at $48. |
Matt Blackman is a full-time technical and financial writer and trader. He produces corporate and financial newsletters, and assists clients in getting published in the mainstream media. He is the host of TradeSystemGuru.com. Matt has earned the Chartered Market Technician (CMT) designation. Find out what stocks and futures Matt is watching on Twitter at www.twitter.com/RatioTrade
| Company: | TradeSystemGuru.com |
| Address: | Box 2589 |
| Garibaldi Highlands, BC Canada | |
| Phone # for sales: | 604-898-9069 |
| Fax: | 604-898-9069 |
| Website: | www.tradesystemguru.com |
| E-mail address: | indextradermb@gmail.com |
Traders' Resource Links | |
| TradeSystemGuru.com has not added any product or service information to TRADERS' RESOURCE. | |
Click here for more information about our publications!
PRINT THIS ARTICLE

Request Information From Our Sponsors
- StockCharts.com, Inc.
- Candle Patterns
- Candlestick Charting Explained
- Intermarket Technical Analysis
- John Murphy on Chart Analysis
- John Murphy's Chart Pattern Recognition
- John Murphy's Market Message
- MurphyExplainsMarketAnalysis-Intermarket Analysis
- MurphyExplainsMarketAnalysis-Visual Analysis
- StockCharts.com
- Technical Analysis of the Financial Markets
- The Visual Investor
- VectorVest, Inc.
- Executive Premier Workshop
- One-Day Options Course
- OptionsPro
- Retirement Income Workshop
- Sure-Fire Trading Systems (VectorVest, Inc.)
- Trading as a Business Workshop
- VectorVest 7 EOD
- VectorVest 7 RealTime/IntraDay
- VectorVest AutoTester
- VectorVest Educational Services
- VectorVest OnLine
- VectorVest Options Analyzer
- VectorVest ProGraphics v6.0
- VectorVest ProTrader 7
- VectorVest RealTime Derby Tool
- VectorVest Simulator
- VectorVest Variator
- VectorVest Watchdog
