

HOT TOPICS LIST
- MACD
- Fibonacci
- RSI
- Gann
- ADXR
- Stochastics
- Volume
- Triangles
- Futures
- Cycles
- Volatility
- ZIGZAG
- MESA
- Retracement
- Aroon
INDICATORS LIST
LIST OF TOPICS
PRINT THIS ARTICLE
by Matt Blackman
This Internet darling IPOed on high hopes for the future but the stock just confirmed a bearish chart pattern that is telling us that those hopes were far from realistic.
Position: N/A
Matt Blackman
Matt Blackman is a full-time technical and financial writer and trader. He produces corporate and financial newsletters, and assists clients in getting published in the mainstream media. He is the host of TradeSystemGuru.com. Matt has earned the Chartered Market Technician (CMT) designation. Find out what stocks and futures Matt is watching on Twitter at www.twitter.com/RatioTrade
PRINT THIS ARTICLE
HEAD & SHOULDERS
LinkedIn: Hope And Reality Finally Collide
05/07/14 12:35:09 PMby Matt Blackman
This Internet darling IPOed on high hopes for the future but the stock just confirmed a bearish chart pattern that is telling us that those hopes were far from realistic.
Position: N/A
| Internet corporate social media site LinkedIn (LNKD) completed its Initial Public Offering in 2011 on high hopes and much fanfare. Shares prices hit a high just north of $120 on their first trading day May 19, 2011 to close the day at $94.25. It had begun trading at $45. The stock peaked at $257.56 on September 11, 2013. As of the April 28, 2014 close, the stock was trading at $148.01 after dropping nearly 6.5% on the day — for an overall decline of more than 40% in seven months. |
|
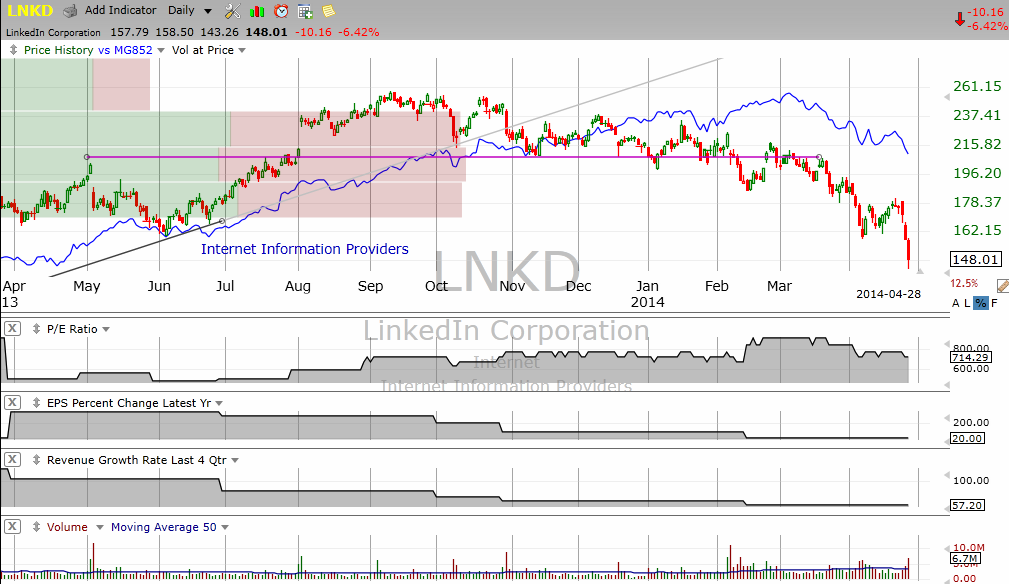
| Figure 1. Daily chart of LinkedIn comparing price to its sub-industry (blue) and some key fundamental metrics over the last year. |
| Graphic provided by: TC2000.com. |
| |
| As Figure 1 clearly shows, the fundamentals for the stock have been out of whack since it was launched when the PE ratio was an extreme 476. This ratio hit a high of 1250 near year end 2013 and has declined since. As of April 28, 2014 it was still trading at a sky high valuation of 714 earnings. As you see in Figures 1 and 2, revenue and earnings paint a clearer picture of the problems — both have steadily declined over the last year — a fact that investors began to wake up to in October 2013. |
|
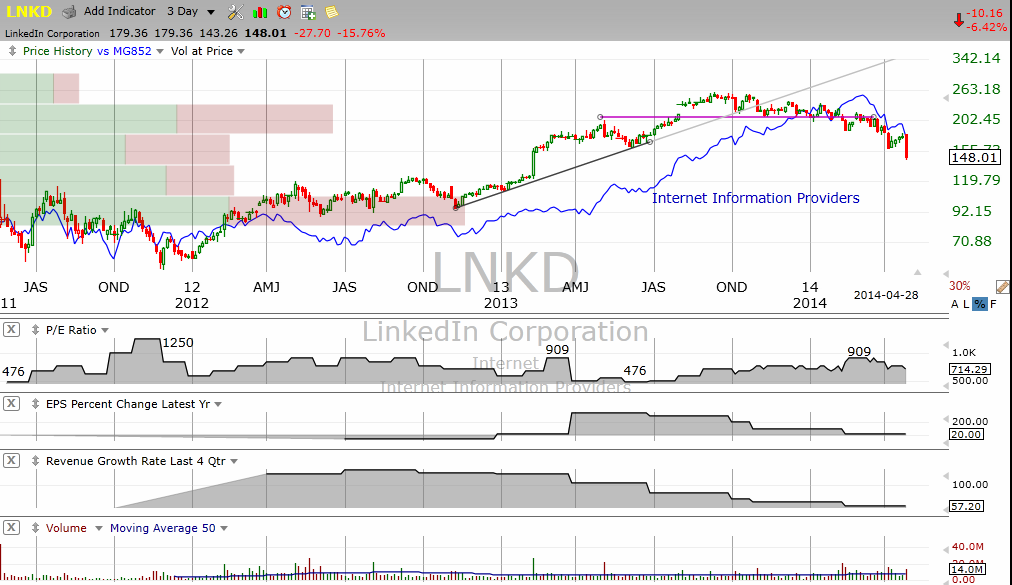
| Figure 2. Three-day chart of LNKD showing the stock from the date of its IPO together with the fundamentals. |
| Graphic provided by: TC2000.com. |
| |
| Technically, unlike some of the other Internet stocks, LNKD did not post any obvious bearish chart patterns near the top other than a shallow double top pattern which was confirmed (November 2013) but then invalidated shortly thereafter before the stock resumed its volatile decline. As you see from the magenta neckline in Figures 1 and 2, it would have been nearly impossible to trade given the many reversals in late 2013 and early 2014. |
|
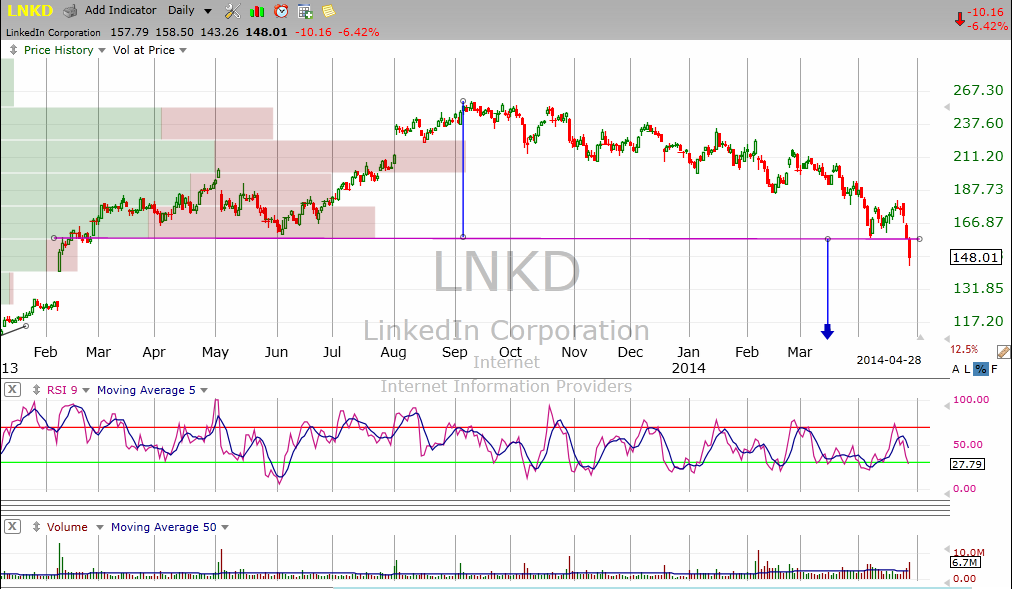
| Figure 3. Daily chart showing the bearish head & shoulders pattern that was confirmed April 28, 2014. |
| Graphic provided by: TC2000.com. |
| |
| But take a closer look at Figure 2 and you will see a bearish head & shoulders pattern with neckline at around $158, just above where the stock traded on April 25, 2014. Notice the large left shoulder and a much smaller right shoulder. The neckline was decisively breached on more than double the 50-day moving average volume. There is a $100 difference between the head and neckline which makes the math for calculating the minimum projected H&S target easy at $58 (Figure 3). |
| This target would take the stock back down to around where it began and therefore must be considered a worst-case outcome. It could be thwarted by a variety of situations — a renewal of the tech led rally, good economic and/or political news or other factor(s) that would reinvigorate investor sentiment. But as Figure 3 also shows, volume-at-price (left side of chart) is telling us that there is not much volume support until the stock drops to around $100 which, given the right trading environment, means that a short trade could be quite profitable from here. |
Matt Blackman is a full-time technical and financial writer and trader. He produces corporate and financial newsletters, and assists clients in getting published in the mainstream media. He is the host of TradeSystemGuru.com. Matt has earned the Chartered Market Technician (CMT) designation. Find out what stocks and futures Matt is watching on Twitter at www.twitter.com/RatioTrade
| Company: | TradeSystemGuru.com |
| Address: | Box 2589 |
| Garibaldi Highlands, BC Canada | |
| Phone # for sales: | 604-898-9069 |
| Fax: | 604-898-9069 |
| Website: | www.tradesystemguru.com |
| E-mail address: | indextradermb@gmail.com |
Traders' Resource Links | |
| TradeSystemGuru.com has not added any product or service information to TRADERS' RESOURCE. | |
Click here for more information about our publications!
Comments

Request Information From Our Sponsors
- StockCharts.com, Inc.
- Candle Patterns
- Candlestick Charting Explained
- Intermarket Technical Analysis
- John Murphy on Chart Analysis
- John Murphy's Chart Pattern Recognition
- John Murphy's Market Message
- MurphyExplainsMarketAnalysis-Intermarket Analysis
- MurphyExplainsMarketAnalysis-Visual Analysis
- StockCharts.com
- Technical Analysis of the Financial Markets
- The Visual Investor
- VectorVest, Inc.
- Executive Premier Workshop
- One-Day Options Course
- OptionsPro
- Retirement Income Workshop
- Sure-Fire Trading Systems (VectorVest, Inc.)
- Trading as a Business Workshop
- VectorVest 7 EOD
- VectorVest 7 RealTime/IntraDay
- VectorVest AutoTester
- VectorVest Educational Services
- VectorVest OnLine
- VectorVest Options Analyzer
- VectorVest ProGraphics v6.0
- VectorVest ProTrader 7
- VectorVest RealTime Derby Tool
- VectorVest Simulator
- VectorVest Variator
- VectorVest Watchdog