

HOT TOPICS LIST
- MACD
- Fibonacci
- RSI
- Gann
- ADXR
- Stochastics
- Volume
- Triangles
- Futures
- Cycles
- Volatility
- ZIGZAG
- MESA
- Retracement
- Aroon
INDICATORS LIST
LIST OF TOPICS
PRINT THIS ARTICLE
by Donald W. Pendergast, Jr.
Be wary of selling into an extended decline, particularly as a stock approaches a major support zone.
Position: N/A
Donald W. Pendergast, Jr.
Freelance financial markets writer and online publisher of the Trendzetterz.com S&P 500 Weekly Forecast service.
PRINT THIS ARTICLE
SHORT SQUEEZE
VRSN: Beware The Bouncing Short
05/05/14 03:59:31 PMby Donald W. Pendergast, Jr.
Be wary of selling into an extended decline, particularly as a stock approaches a major support zone.
Position: N/A
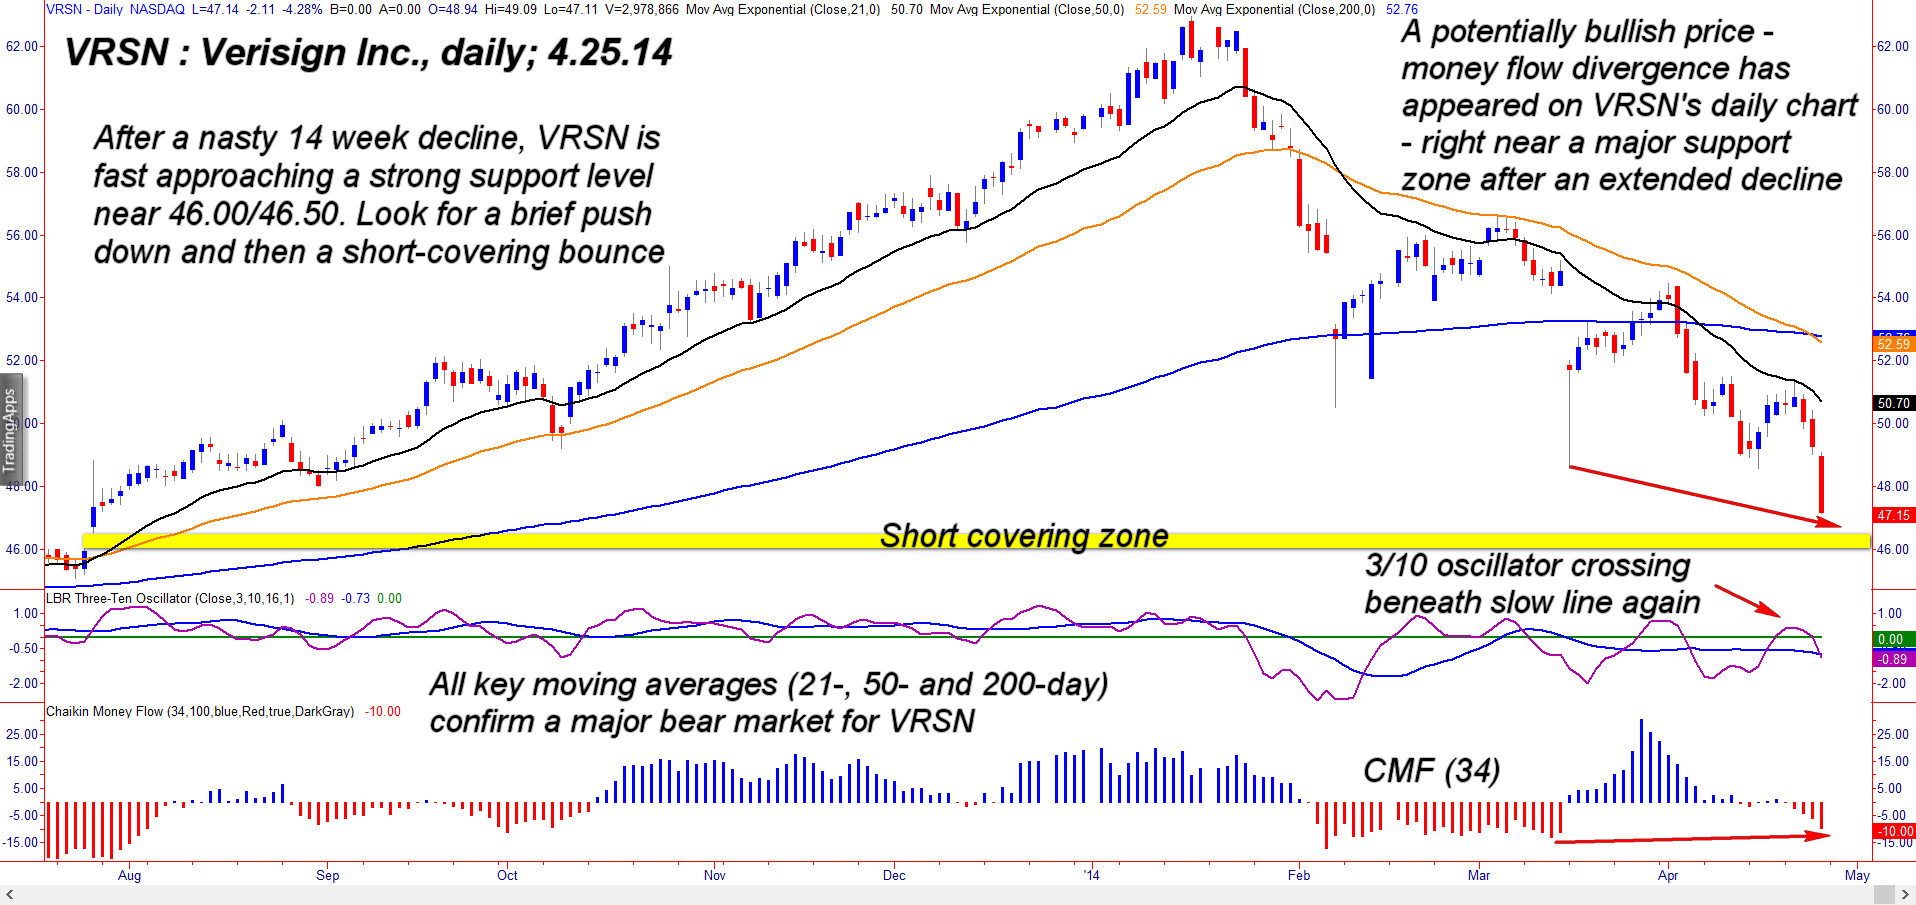
| A 25% decline in 14 weeks may not sound all that awful, but considering how smoothly and steadily that Verisign Inc. (VRSN) shares had been trending prior to reaching their major multicycle high on January 16, 2014, the volatile move lower since then looks like an absolute train wreck, one that has caused serious damage to this stock's long-term technical picture. But with a high probability short squeeze bounce likely within the next few trading sessions, perhaps the worst of the selling pressure has already been exhausted. Here's a closer look (Figure 1). |
|
| Figure 1. Verisign Inc. (VRSN): as bearish as this daily chart looks right now, all the key ingredients needed for a short squeeze are already in place. |
| Graphic provided by: TradeStation. |
| |
| Coming out of its multicycle low of June 21, 2013, VRSN started upward in a remarkable, low-volatility uptrend that just kept on going for the better part of seven months; note how the spread between the 21- and 50-day exponential moving averages (EMA) kept on increasing during that period, with the 200-day EMA also steadily rising. Between late July/mid-December 2013 there were no less than five valid pullback entries to either the 21- or 50-day EMAs; each was followed with a profitable move higher in the direction of the major trend. Eventually, though, all big trends end, and in this case, the ending was abrupt and the damage extensive. The selloff since mid-January 2014 has evolved by way of three major down thrusts — with the third bearish wave already extended to a significant degree. Downward momentum is increasing (according the three main averages) but there are warning signs dead ahead for any bears still short this high volume Nasdaq 100 (.NDX, QQQ) component issue: 1. Some truly great technicians (like Linda Bradford Raschke and Larry Pesavento) have noted that after a powerful 'three drive' move that a major trend will sometimes terminate; well, we definitely have three distinct, high intensity down thrusts here on VRSN's daily graph. 2. This possibly mature downtrend is now only about a dollar above a major support area — one formed by the open gap from way back in July 2013. The horizontal yellow line depicts this zone, which has a high probability of acting as the trigger point for a substantial short squeeze move. 3. The 34-day Chaikin Money flow histogram (CMF)(34) is also manifesting a notably bullish price/money flow divergence. Together, these three points of technical evidence make a good case for the bears to begin scaling out of their VRSN short positions, hopefully sooner rather than later. |
|
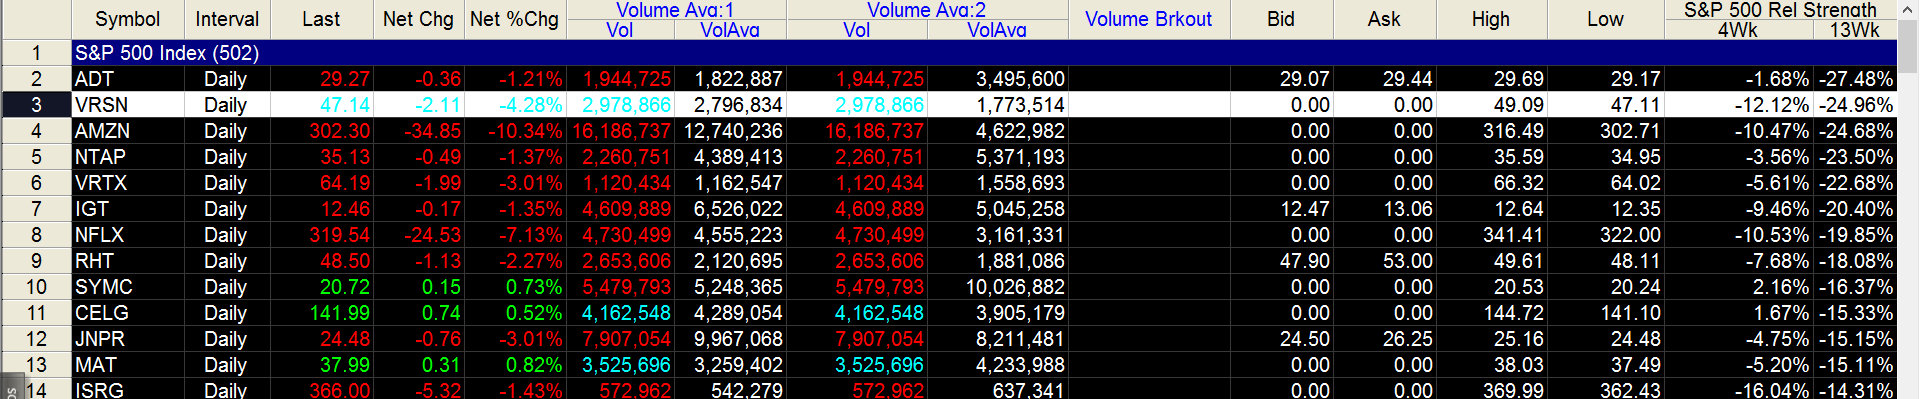
| Figure 2. VRSN has been significantly underperforming the S&P 500 index (.SPX) over the past four- and 13-week periods. |
| Graphic provided by: TradeStation. |
| Graphic provided by: TradeStation RadarScreen. |
| |
| It's way too early to suggest any kind of long entry in VRSN; momentum remains negative and with the 200-day ema already sloping lower, this is a market in which to look for rallies to short, not long pullbacks to buy. Should you see VRSN bounce significantly from the yellow support zone, look to see how far up it rises before losing momentum near either the 21- or 50-day ema. Those kind of bear market bounces can be great short entry locations in a severely damaged large cap stock. Keep your account risk at no more than 1% and manage such short positions with absolute care and watchfulness. Trade wisely until we meet here again. |
Freelance financial markets writer and online publisher of the Trendzetterz.com S&P 500 Weekly Forecast service.
| Title: | Market consultant and writer |
| Company: | Trendzetterz |
| Address: | 81 Hickory Hollow Drive |
| Crossville, TN 38555 | |
| Phone # for sales: | 904-303-4814 |
| Website: | trendzetterz.com |
| E-mail address: | support@trendzetterz.com |
Traders' Resource Links | |
| Trendzetterz has not added any product or service information to TRADERS' RESOURCE. | |
Click here for more information about our publications!
PRINT THIS ARTICLE

Request Information From Our Sponsors
- StockCharts.com, Inc.
- Candle Patterns
- Candlestick Charting Explained
- Intermarket Technical Analysis
- John Murphy on Chart Analysis
- John Murphy's Chart Pattern Recognition
- John Murphy's Market Message
- MurphyExplainsMarketAnalysis-Intermarket Analysis
- MurphyExplainsMarketAnalysis-Visual Analysis
- StockCharts.com
- Technical Analysis of the Financial Markets
- The Visual Investor
- VectorVest, Inc.
- Executive Premier Workshop
- One-Day Options Course
- OptionsPro
- Retirement Income Workshop
- Sure-Fire Trading Systems (VectorVest, Inc.)
- Trading as a Business Workshop
- VectorVest 7 EOD
- VectorVest 7 RealTime/IntraDay
- VectorVest AutoTester
- VectorVest Educational Services
- VectorVest OnLine
- VectorVest Options Analyzer
- VectorVest ProGraphics v6.0
- VectorVest ProTrader 7
- VectorVest RealTime Derby Tool
- VectorVest Simulator
- VectorVest Variator
- VectorVest Watchdog