HOT TOPICS LIST
- MACD
- Fibonacci
- RSI
- Gann
- ADXR
- Stochastics
- Volume
- Triangles
- Futures
- Cycles
- Volatility
- ZIGZAG
- MESA
- Retracement
- Aroon
INDICATORS LIST
LIST OF TOPICS
PRINT THIS ARTICLE
by Koos van der Merwe
Welcome to Family Dollar stores, your neighbourhood dollar discount store.
Position: Buy
Koos van der Merwe
Has been a technical analyst since 1969, and has worked as a futures and options trader with First Financial Futures in Johannesburg, South Africa.
PRINT THIS ARTICLE
RSI
Looking At Family Dollar
05/05/14 03:54:33 PMby Koos van der Merwe
Welcome to Family Dollar stores, your neighbourhood dollar discount store.
Position: Buy
| Family Dollar (FDO), founded in 1959 by Leon Levine, a 21 year old entrepreneur, is a discount retailer that carries national name brands with shoppers finding many items at $1 or less. The company operates more than 8,000 stores in 46 states. |

|
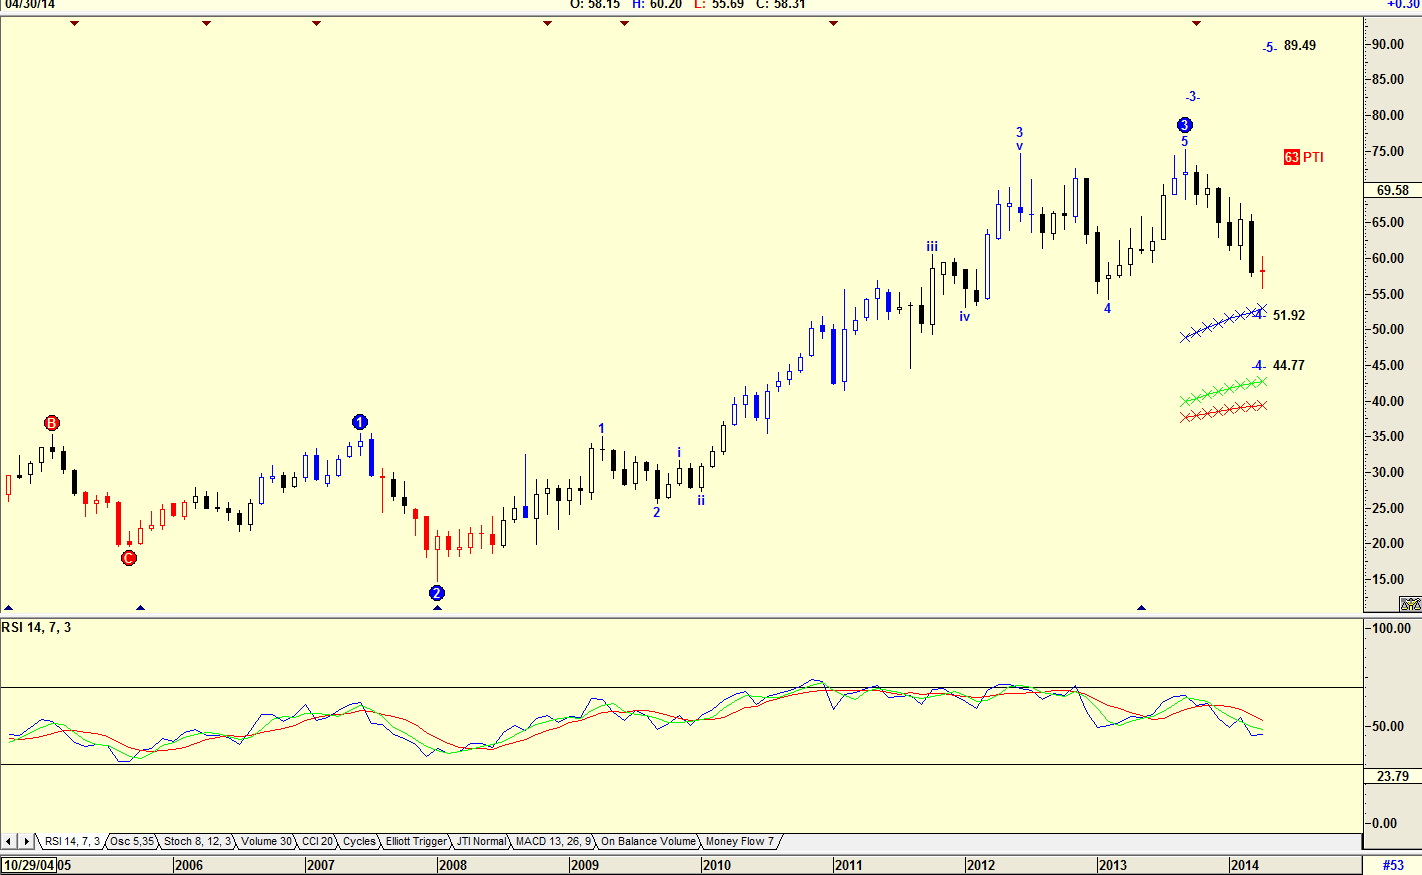
| Figure 1. Monthly chart with Elliott wave count. |
| Graphic provided by: AdvancedGET. |
| |
| The chart in Figure 1 is a monthly chart with an Elliott wave count suggesting that the share price is in a WAVE 4 correction with a target for the WAVE 4 bottom at either $51.92 or $44.77. The PTI (Probability Index) is at 63, suggesting that the WAVE 5 target of $89.49 should be reached. With the RSI trending downwards from an overbought position, either of the WAVE 4 targets have to be reached first before the share price will start rising. |

|
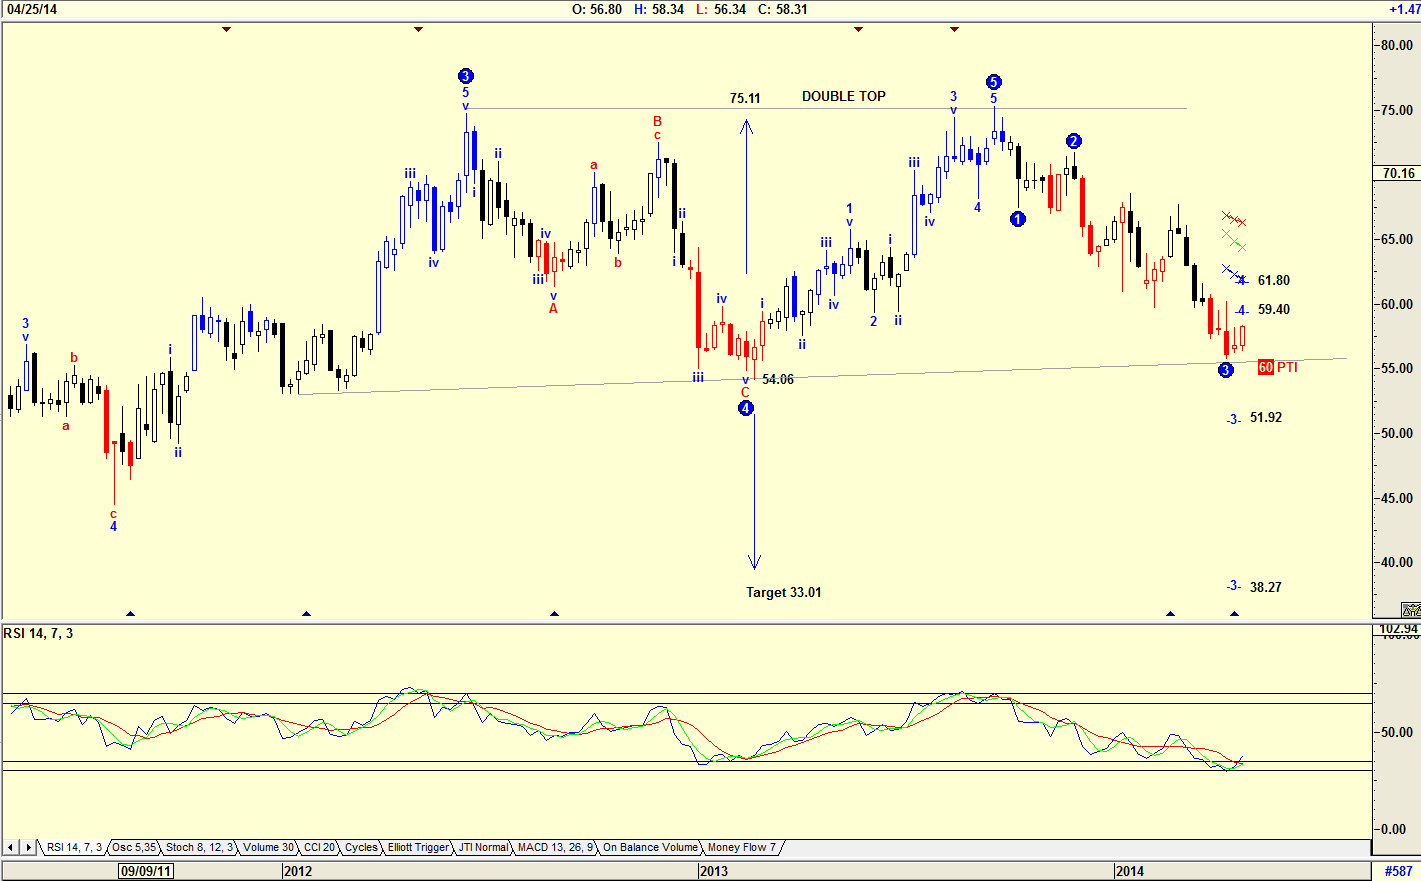
| Figure 2. Weekly chart showing a double top. |
| Graphic provided by: AdvancedGET. |
| |
| The chart in Figure 2 is a weekly chart showing the double top formation that developed, with WAVE 5 equalling and not exceeding the high of WAVE 3. This formation suggests a downside target of $33.01. The PTI at 60 is suggesting a WAVE 3 target of $51.92 or $38.27, the latter being close to the double top target. A support line, however, suggests support at current levels, so you could expect the share price to rise in a Wave 4 to either $59.40 or $61.80. The RSI indicator is at oversold levels suggesting a buy. |

|
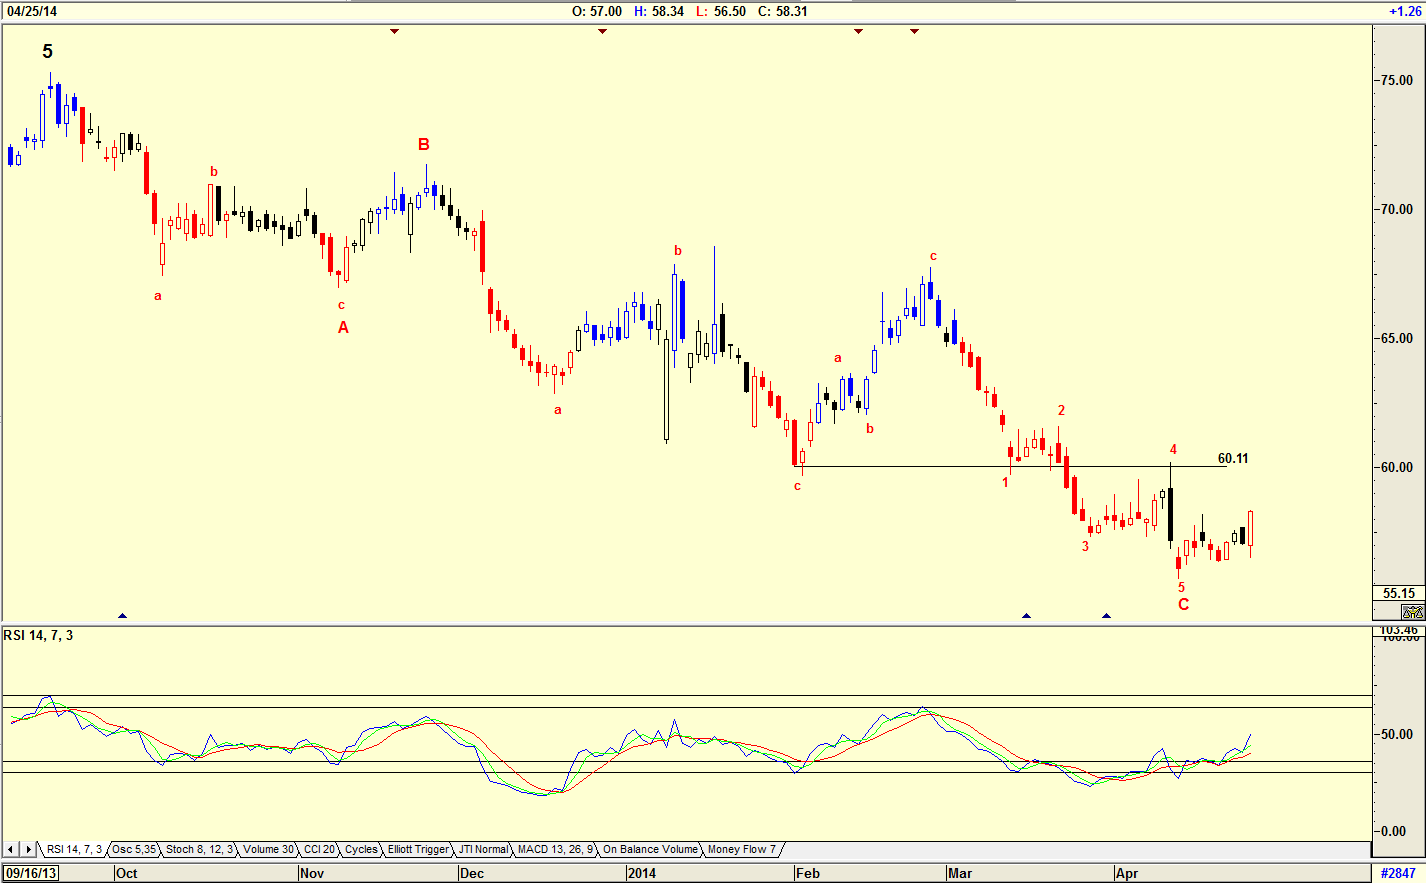
| Figure 3. Daily chart suggesting a buy signal and target. |
| Graphic provided by: AdvancedGET. |
| |
| The chart in Figure 3 is a daily chart with a complicated ABC correction. The RSI indicator is suggesting a buy signal but no target has been suggested. I then look at the resistance level shown on the chart of $60.11 as the initial target with hopefully a higher target should the upward move in a WAVE I be strong. |

|
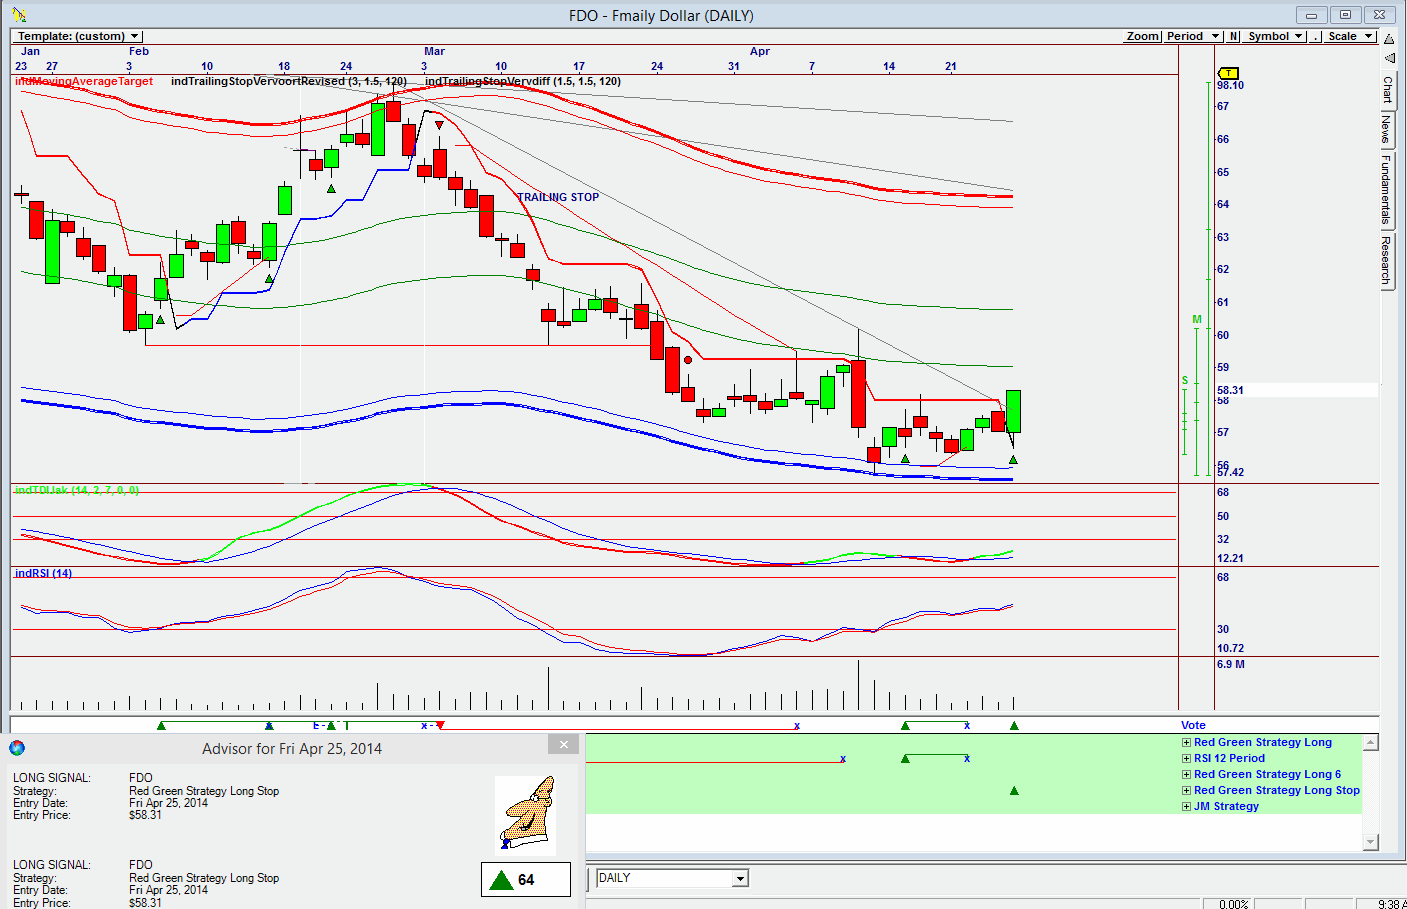
| Figure 4. Omnitrader chart showing a Vote line buy. |
| Graphic provided by: Omnitrader.. |
| |
| The chart in Figure 4 is an Omnitrader chart that brought Family Dollar to my attention. On April 25, 2014 the share gave a buy signal with an advisor buy rating of 64 based on the Red Green Strategy Long Stop with an entry price of $58.31. Volume rose as the price rose, showing strength. The TDI Jak indicator and the RSI indicator are positive. With FD suggesting a buy, is this an indication the retail sector of the market is starting to recover? I would be a buyer of FD shares at present levels, but I would keep a close watch on the trailing stop as shown on the Omnitrader chart. Should the price fall below the stop, I would close out my position. |
Has been a technical analyst since 1969, and has worked as a futures and options trader with First Financial Futures in Johannesburg, South Africa.
| Address: | 3256 West 24th Ave |
| Vancouver, BC | |
| Phone # for sales: | 6042634214 |
| E-mail address: | petroosp@gmail.com |
Click here for more information about our publications!
Comments

Request Information From Our Sponsors
- StockCharts.com, Inc.
- Candle Patterns
- Candlestick Charting Explained
- Intermarket Technical Analysis
- John Murphy on Chart Analysis
- John Murphy's Chart Pattern Recognition
- John Murphy's Market Message
- MurphyExplainsMarketAnalysis-Intermarket Analysis
- MurphyExplainsMarketAnalysis-Visual Analysis
- StockCharts.com
- Technical Analysis of the Financial Markets
- The Visual Investor
- VectorVest, Inc.
- Executive Premier Workshop
- One-Day Options Course
- OptionsPro
- Retirement Income Workshop
- Sure-Fire Trading Systems (VectorVest, Inc.)
- Trading as a Business Workshop
- VectorVest 7 EOD
- VectorVest 7 RealTime/IntraDay
- VectorVest AutoTester
- VectorVest Educational Services
- VectorVest OnLine
- VectorVest Options Analyzer
- VectorVest ProGraphics v6.0
- VectorVest ProTrader 7
- VectorVest RealTime Derby Tool
- VectorVest Simulator
- VectorVest Variator
- VectorVest Watchdog
