HOT TOPICS LIST
- MACD
- Fibonacci
- RSI
- Gann
- ADXR
- Stochastics
- Volume
- Triangles
- Futures
- Cycles
- Volatility
- ZIGZAG
- MESA
- Retracement
- Aroon
INDICATORS LIST
LIST OF TOPICS
PRINT THIS ARTICLE
by Donald W. Pendergast, Jr.
The recent bounce in the Nasdaq 100 index may be in termination mode now, with a fresh bearish reversal soon to appear.
Position: N/A
Donald W. Pendergast, Jr.
Freelance financial markets writer and online publisher of the Trendzetterz.com S&P 500 Weekly Forecast service.
PRINT THIS ARTICLE
BROADENING FORMATION
QQQ: Hidden Divergence And Bearish Pattern
05/02/14 04:55:12 PMby Donald W. Pendergast, Jr.
The recent bounce in the Nasdaq 100 index may be in termination mode now, with a fresh bearish reversal soon to appear.
Position: N/A
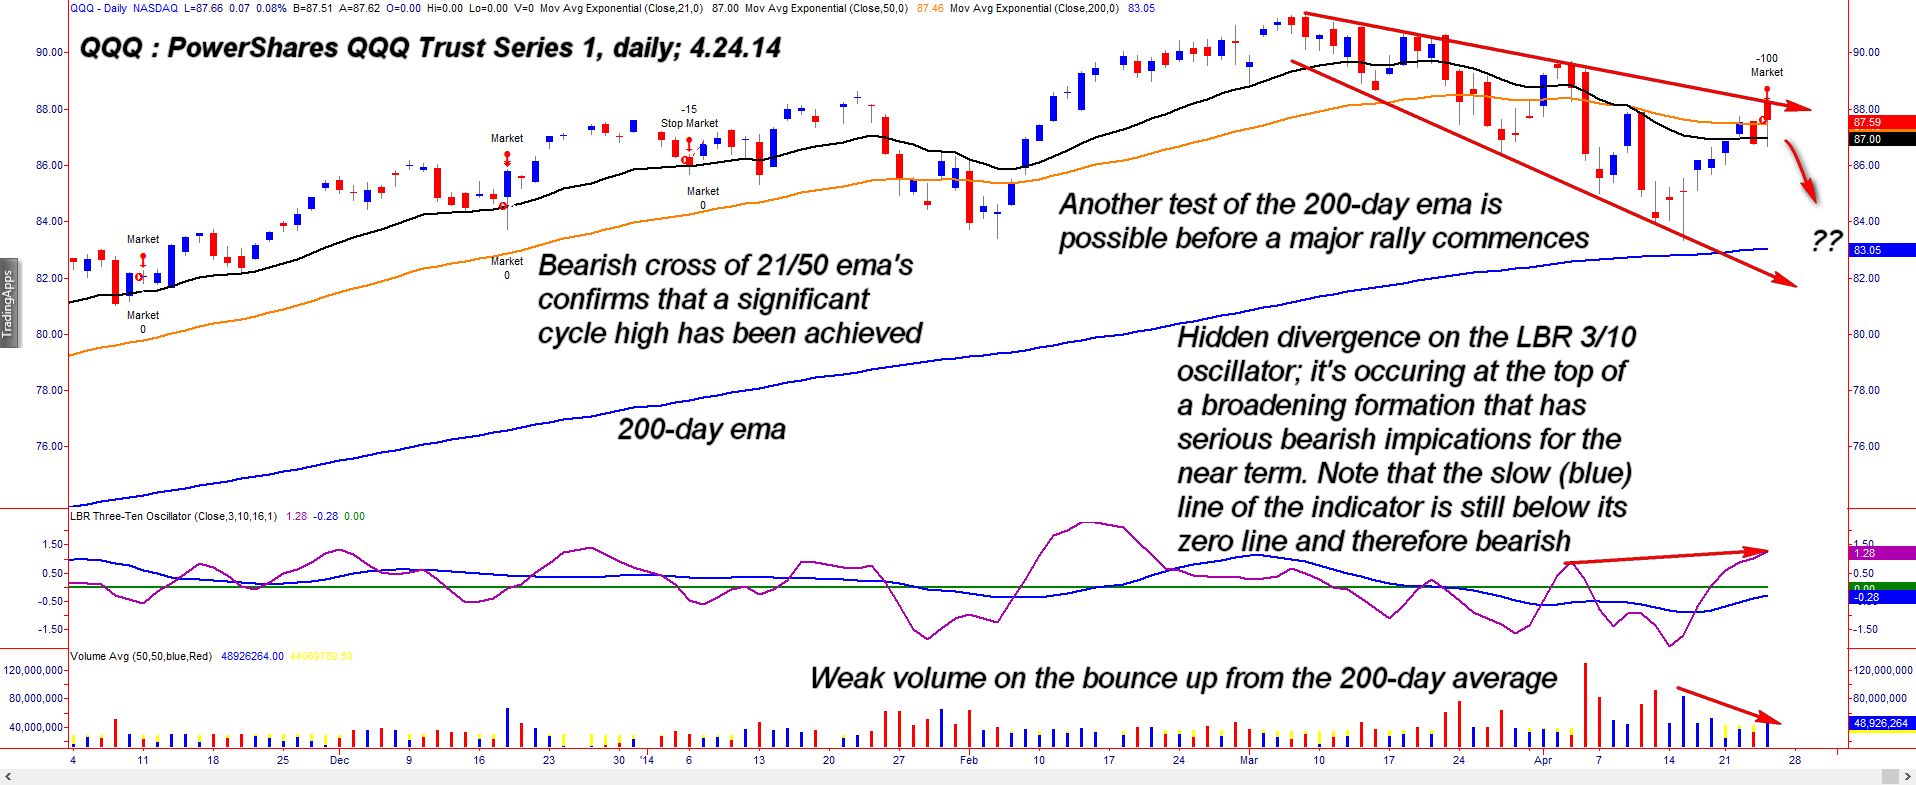
| The nearly six-week long correction in the Nasdaq 100 index (.NDX, QQQ) was strong enough to slice nearly 9% from its value, but that the decline unfolded in a fairly orderly broadening formation in no way implied any kind of panic selling — the kind of fear driven selloffs we've seen every once in a while since the Great Bear of 2007-2009 finally stopped eating everyone's lunch. At the same time, it appears that the index is due for a possible retest of its April 15, 2014 lows, possibly sooner rather than later. Here's a closer look (Figure 1). |

|
| Figure 1. The Nasdaq 100 index (QQQ) sports a bearish broadening formation pattern; light volume on the recent upswing and a hidden divergence on the 3/10 oscillator should be a boon for the bears. |
| Graphic provided by: TradeStation. |
| |
| The so-called 'perma-bears' were probably excited at the prospect of the March/April 2014 cycle high rollover in the major US stock indexes turning into a replay of the start of the 2000-2002 or 2007-2009 bear markets, but so far they have had only limited opportunity for profit on the short side. The 9% decline toward the 200-day exponential moving average (EMA) was far more suited to day traders and short-term swing traders than it was to long-term trend followers, who were frustrated at every turn. The 200-day EMA held back further declines — as anticipated — and saw the launch of a healthy relief rally, which happens to now be right at the leading edge of the upper channel of a very bearish broadening (megaphone) pattern. All experienced traders know that beautiful patterns like this one can and do fail, but what makes this one appealing to bears is the additional technicals that seems to spell trouble ahead for the QQQ: 1. The 34-day Chaikin Money flow histogram (CMF)(34) is still very bearish, with the 89-day variant of the same being barely positive. 2. The LBR 3/10 oscillator fast line (purple) has exceeded its high made at the April 3, 2014 swing high; this is known as a "hidden divergence" and implies a reversal in the near future for the QQQ, especially since the slow line (blue) of the 3/10 is still below its zero line. 3. Of course, the ongoing pattern down/up swings within the large broadening pattern is also suggesting that a low risk short entry may be at hand in the QQQ. 4. AB=CD Fibonacci swing ratio calculations also suggest that a fresh downturn could be good for 2.5 to 3.5 points or even another retest of the 200-day EMA. |

|
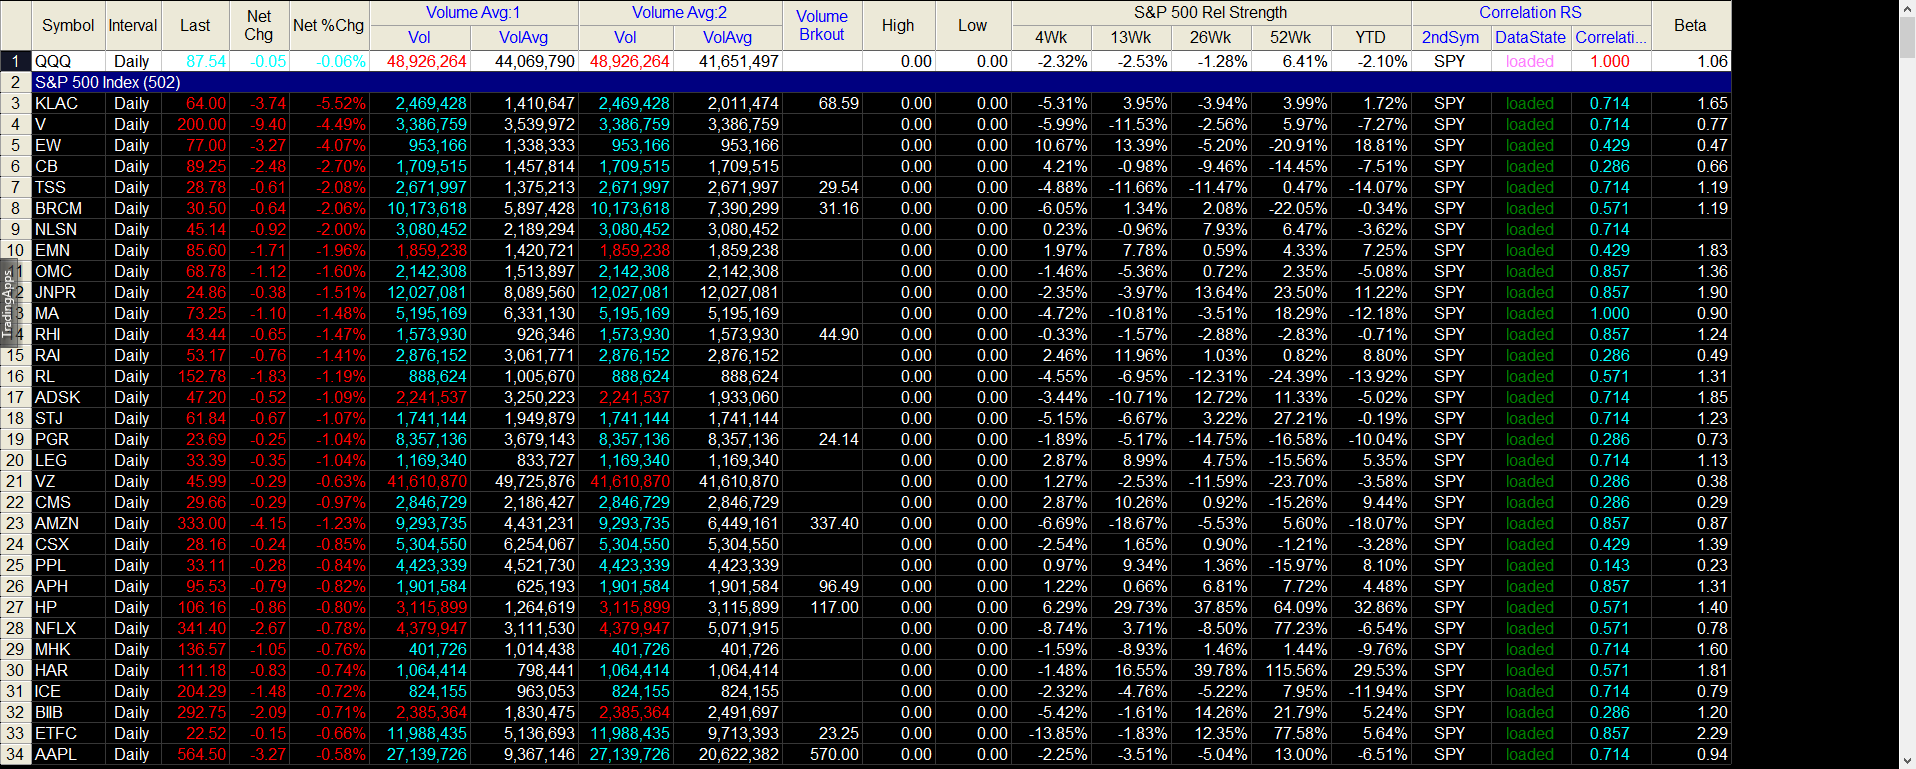
| Figure 2. QQQ has been underperforming the S&P 500 index (.SPX, SPY) over the past 4-, 13- and 26-week periods. |
| Graphic provided by: TradeStation. |
| Graphic provided by: TradeStation RadarScreen. |
| |
| Playing this setup is easy: 1. If using QQQ, look to short on a break below 86.65, using 87.80 as your initial stop. It is important that you see a negative ratio of up volume vs. down volume ($UVOLQ/$DVOLQ) on such a short entry, as that will ensure you have some decent downside momentum working in your favor. If you get a fast two or three point move to the downside, cover your short position and get back into cash, especially if the QQQ gets close to the 200-day EMA again. 2. You can also look to short Nasdaq 100 stocks that have negative 13-week relative strength against the .NDX, such as TSCO, AMZN, VRTX, NTAP and MAT. You'll need to do your homework on these setups to find a low risk short entry that you find attractive. Keep your account risks small (1 to 2% max on the QQQ and 1% or so on individual stock trades) and be nimble and quick to cover such short positions at the first hint of a market reversal. Trade wisely until we meet here again. |
Freelance financial markets writer and online publisher of the Trendzetterz.com S&P 500 Weekly Forecast service.
| Title: | Market consultant and writer |
| Company: | Trendzetterz |
| Address: | 81 Hickory Hollow Drive |
| Crossville, TN 38555 | |
| Phone # for sales: | 904-303-4814 |
| Website: | trendzetterz.com |
| E-mail address: | support@trendzetterz.com |
Traders' Resource Links | |
| Trendzetterz has not added any product or service information to TRADERS' RESOURCE. | |
Click here for more information about our publications!
PRINT THIS ARTICLE

Request Information From Our Sponsors
- StockCharts.com, Inc.
- Candle Patterns
- Candlestick Charting Explained
- Intermarket Technical Analysis
- John Murphy on Chart Analysis
- John Murphy's Chart Pattern Recognition
- John Murphy's Market Message
- MurphyExplainsMarketAnalysis-Intermarket Analysis
- MurphyExplainsMarketAnalysis-Visual Analysis
- StockCharts.com
- Technical Analysis of the Financial Markets
- The Visual Investor
- VectorVest, Inc.
- Executive Premier Workshop
- One-Day Options Course
- OptionsPro
- Retirement Income Workshop
- Sure-Fire Trading Systems (VectorVest, Inc.)
- Trading as a Business Workshop
- VectorVest 7 EOD
- VectorVest 7 RealTime/IntraDay
- VectorVest AutoTester
- VectorVest Educational Services
- VectorVest OnLine
- VectorVest Options Analyzer
- VectorVest ProGraphics v6.0
- VectorVest ProTrader 7
- VectorVest RealTime Derby Tool
- VectorVest Simulator
- VectorVest Variator
- VectorVest Watchdog
