HOT TOPICS LIST
- MACD
- Fibonacci
- RSI
- Gann
- ADXR
- Stochastics
- Volume
- Triangles
- Futures
- Cycles
- Volatility
- ZIGZAG
- MESA
- Retracement
- Aroon
INDICATORS LIST
LIST OF TOPICS
PRINT THIS ARTICLE
by Koos van der Merwe
With April coming to an end, and the "sell in May" mantra out there, is it time to take profits and sit back?
Position: Hold
Koos van der Merwe
Has been a technical analyst since 1969, and has worked as a futures and options trader with First Financial Futures in Johannesburg, South Africa.
PRINT THIS ARTICLE
ELLIOTT WAVE
Time For A Correction?
04/30/14 04:08:19 PMby Koos van der Merwe
With April coming to an end, and the "sell in May" mantra out there, is it time to take profits and sit back?
Position: Hold
| With the Ukraine crises weighing heavily on everyone's mind, with the "sell in May and go away" mantra adding to that uncertainty, with well-known bears in the market calling for a market crash greater than the technology bubble crash, and with investors becoming extremely cautious after the two market crash bubbles suffered over the last 13 years, is it time to stand aside and wait for the market to tell us where it is going? Is caution the name of the game? |

|
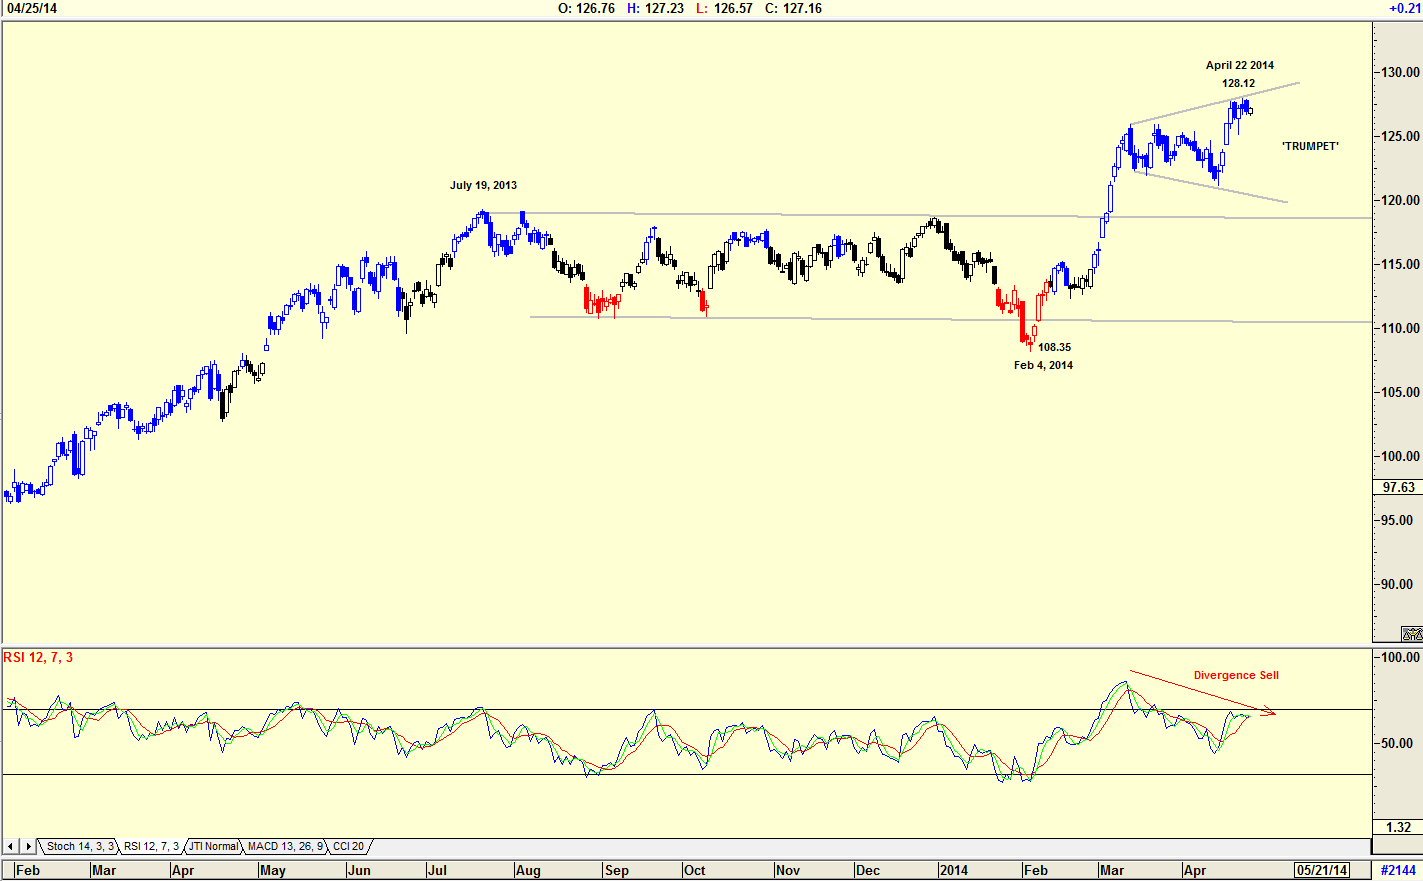
| Figure 1. Daily chart of Berkshire Hathaway. |
| Graphic provided by: AdvancedGET. |
| |
| Warren Buffet is well known to all as a solid profitable investor. His strategy, as we all know, is to invest in a company that has solid management. He has a buy and hold strategy and the share price value of his companies reflect his successful investment strategy, but when the share price of Berkshire Hathaway B shares reflect market uncertainty, do you sell in April and take a breather? The chart in Figure 1 is a daily chart of Berkshire Hathaway B shares. The chart shows how the share price has been moving in a sideways pattern since July 19, 2013 breaking down in February 2014 and then recovering to a new high of $128.12 by April 22, 2014. The pattern that has formed however, is a broadening formation known as a 'trumpet'. A trumpet formation suggests uncertainty, and with the numerous negatives in the world today, that uncertainty is understandable. Note the RSI indicator has given a divergence sell signal. The share price makes new highs while the RSI makes lower highs. |

|
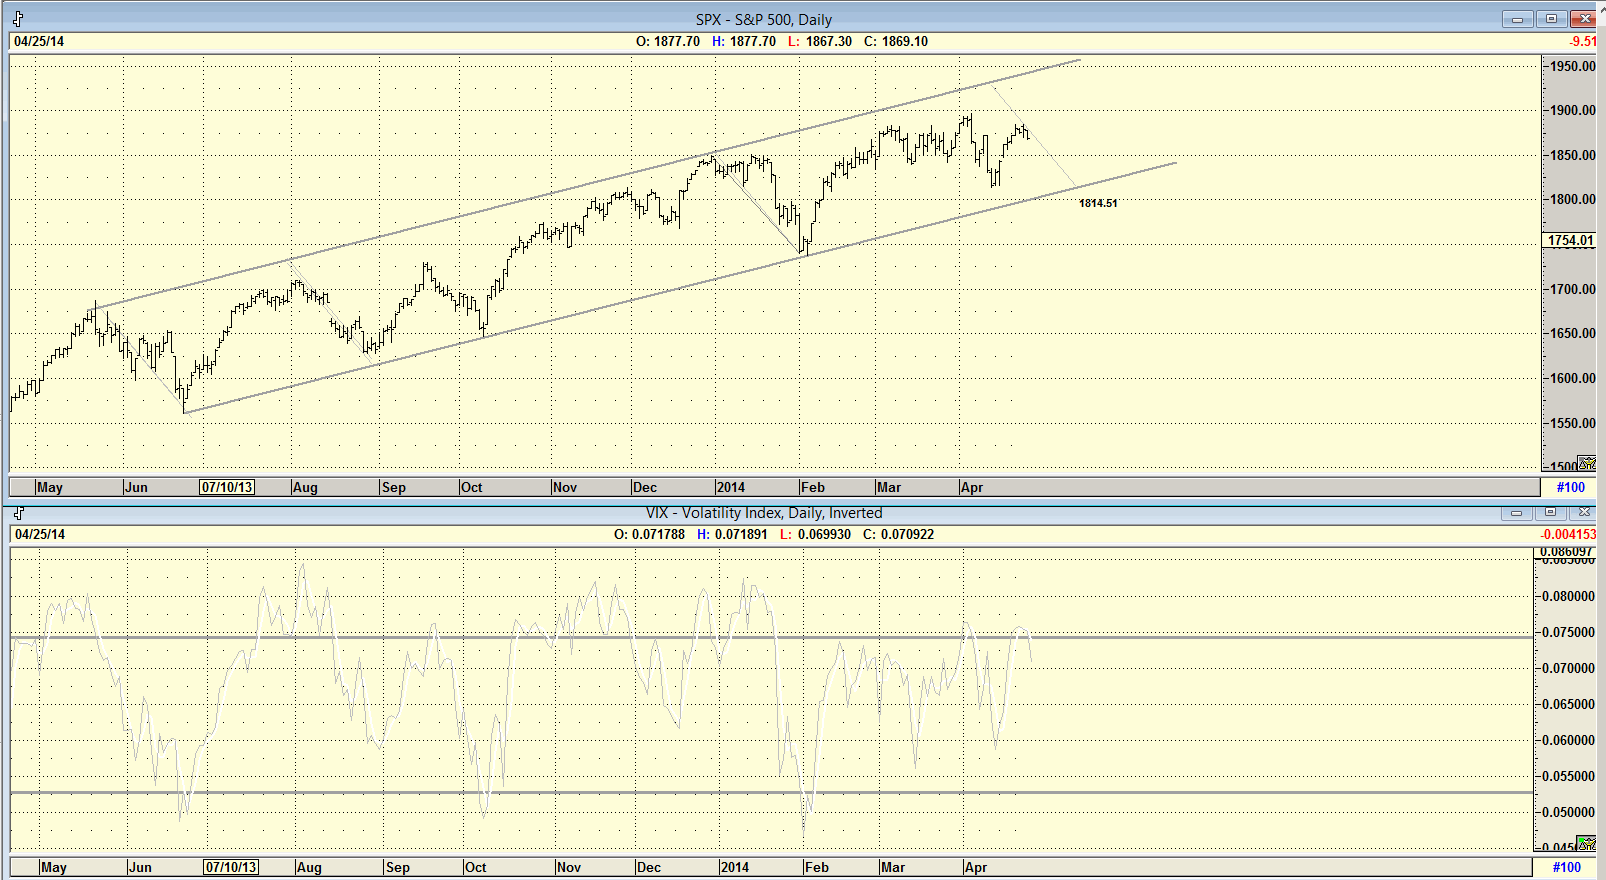
| Figure 2. Daily chart of S&P 500 index suggesting target. |
| Graphic provided by: AdvancedGET. |
| |
| The chart in Figure 2 is a chart of the S&P 500 index with a chart of the VIX, inverted. The VIX has given a sell signal, so you can expect the S&P 500 Index to fall to the support line in the region of 1814.51. |

|
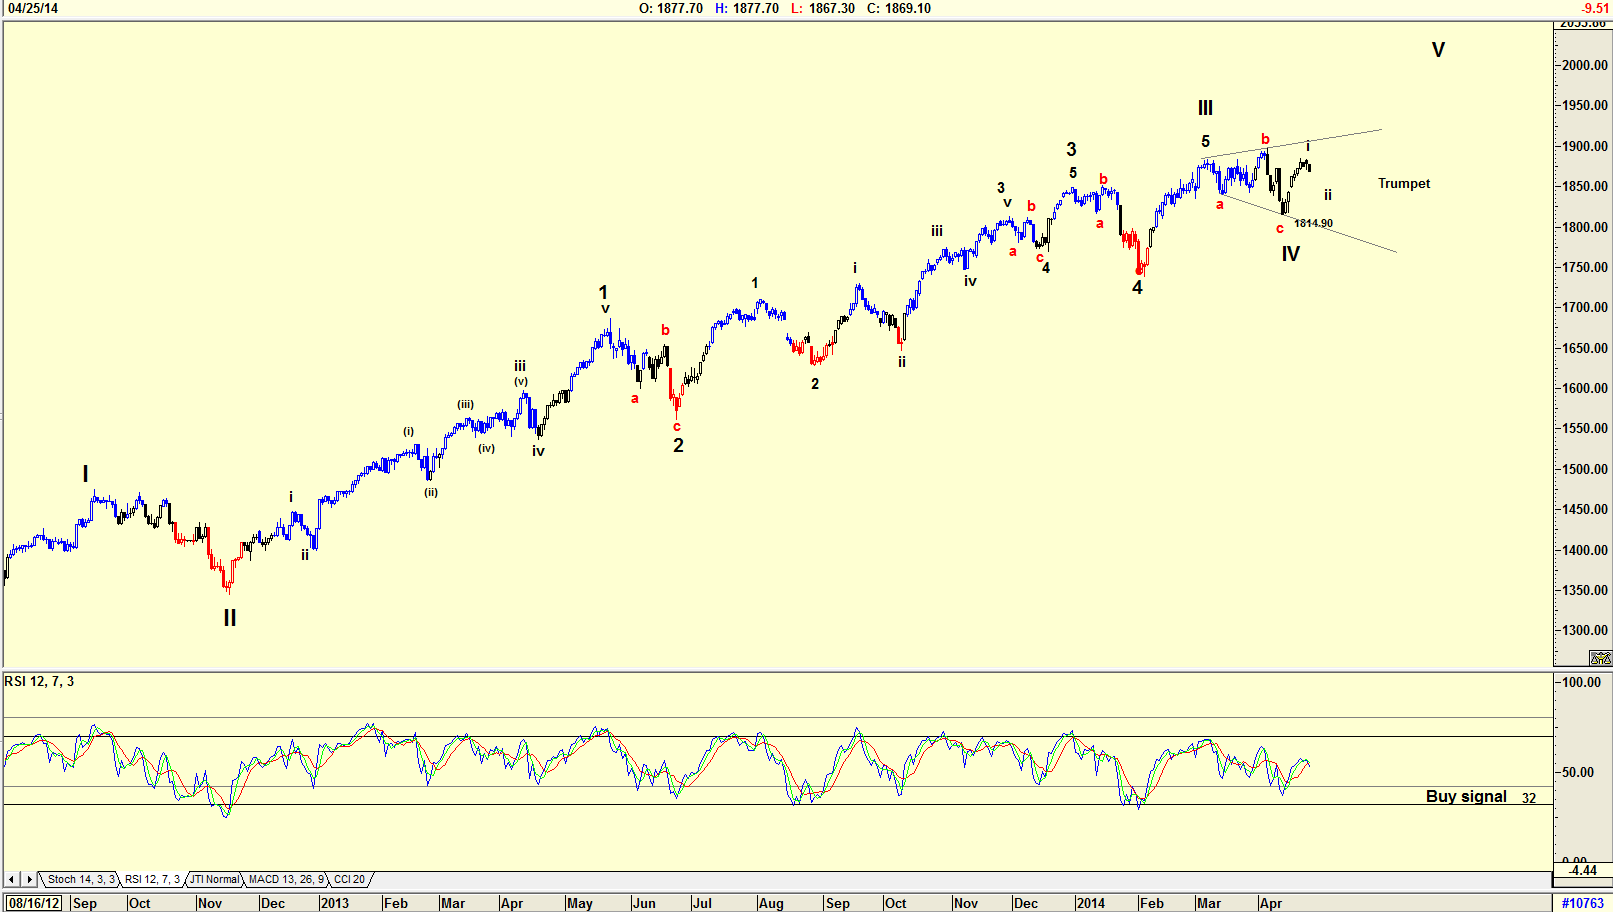
| Figure 3. Daily chart of the S&P500 index with Elliott wave count and trumpet formation. |
| Graphic provided by: AdvancedGET. |
| |
| The chart in Figure 3 is a daily chart of the S&P 500 Index showing an Elliott wave count that is suggesting the index could be in a wave ii of a WAVE V. Of course this count could change as the index progresses with WAVE IV becoming more complicated. The Elliott rule is that if WAVE II is a simple wave, then WAVE IV will be a complicated wave, and vice versa. Looking at WAVE II, it does not look at all complicated, suggesting that WAVE IV should be complicated. Should this indeed occur, then we could see the index falling below 1814.90. The RSI looks as though it has given a buy signal. However, it could fall lower below the 32 horizontal line. Once again notice the trumpet pattern that has formed suggesting market uncertainty. |

|
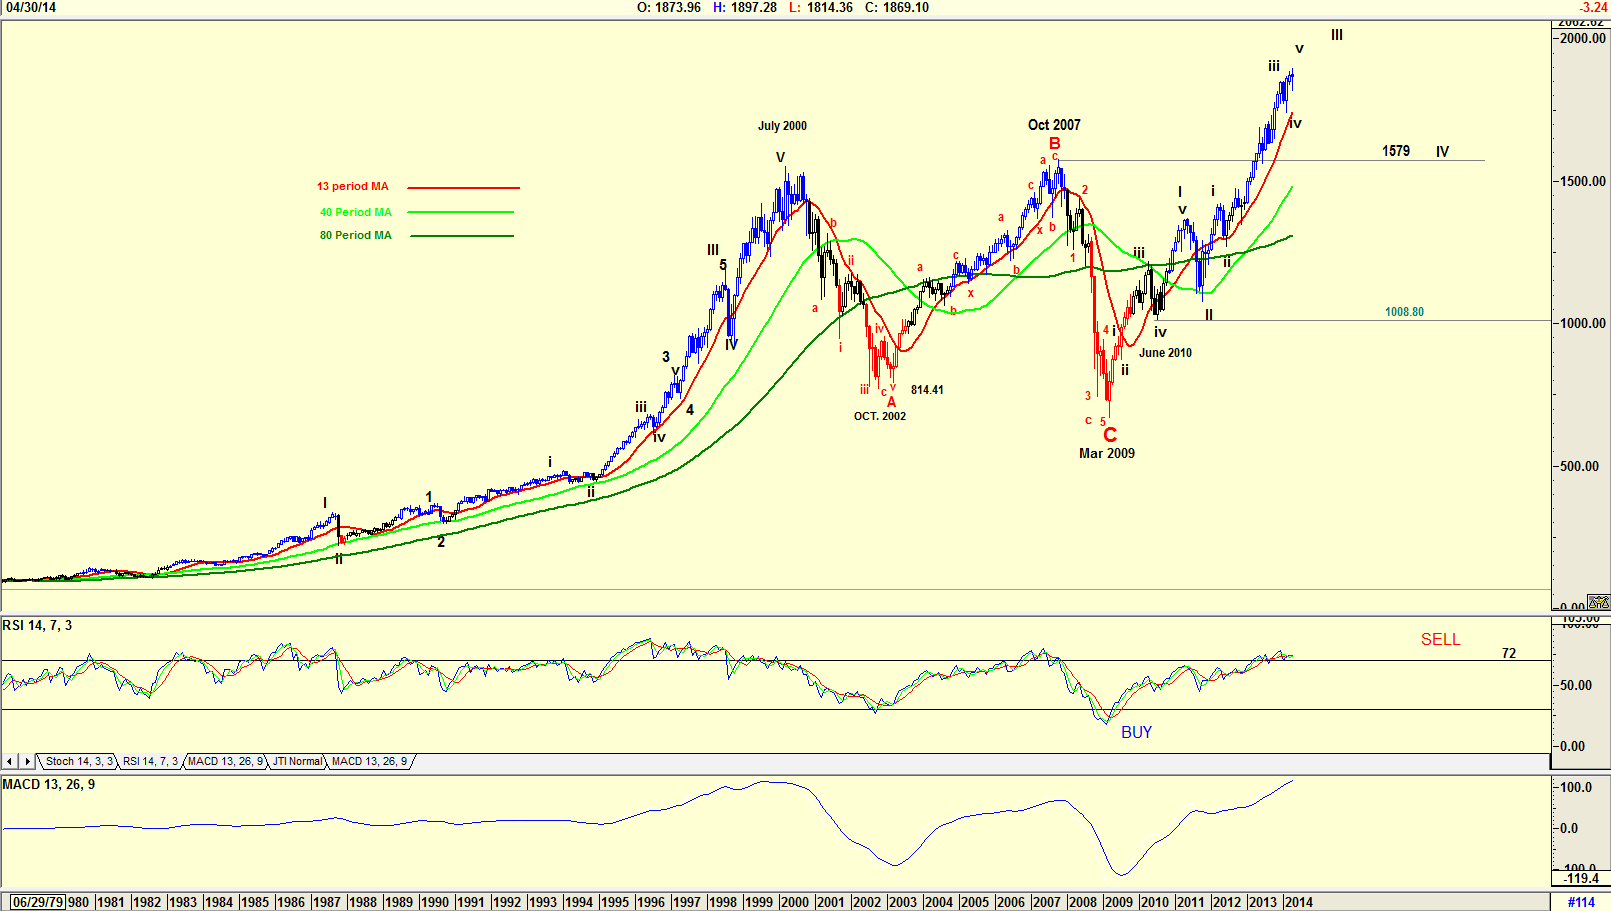
| Figure 4. Monthly chart of S&P500 index suggesting a correction is due. |
| Graphic provided by: AdvancedGET. |
| |
| My final chart in Figure 4 is a monthly chart of the S&P 500 index. This chart shows the major corrections of 2000 and 2007 with major WAVE C bottoming in March 2009. The Elliott wave count suggests that the index could be tracing a wave v of WAVE III. The RSI index is at overbought levels, but has not given a sell signal. This will only happen when the RSI falls below the 72 horizontal line. Looking at previous RSI moves, one can see that the index tends to remain at overbought levels for a number of months before signalling a sell. The MACD indicator has also not given a sell signal. The chart though, is disturbing in that it is suggesting a strong correction, a major WAVE IV will occur once WAVE III has finalized, which could be in the near future. With WAVE II being a simple wave, WAVE IV should be a complicated wave. This does not bode well for the remaining months of 2014. With the present uncertainty in the Ukraine, with the long term charts suggesting that a strong correction should occur, and with the daily trumpet patterns developing, uncertainty as to market direction exists for the coming months. For the long term however, Figure 4, the monthly chart, is suggesting that a WAVE V up will follow the WAVE IV correction — suggesting that the main trend for the years ahead are still bullish. Caution prevails and pessimism exists, but a buying opportunity is there. |
Has been a technical analyst since 1969, and has worked as a futures and options trader with First Financial Futures in Johannesburg, South Africa.
| Address: | 3256 West 24th Ave |
| Vancouver, BC | |
| Phone # for sales: | 6042634214 |
| E-mail address: | petroosp@gmail.com |
Click here for more information about our publications!
Comments
Date: 05/05/14Rank: 5Comment: always a great job.

|

Request Information From Our Sponsors
- StockCharts.com, Inc.
- Candle Patterns
- Candlestick Charting Explained
- Intermarket Technical Analysis
- John Murphy on Chart Analysis
- John Murphy's Chart Pattern Recognition
- John Murphy's Market Message
- MurphyExplainsMarketAnalysis-Intermarket Analysis
- MurphyExplainsMarketAnalysis-Visual Analysis
- StockCharts.com
- Technical Analysis of the Financial Markets
- The Visual Investor
- VectorVest, Inc.
- Executive Premier Workshop
- One-Day Options Course
- OptionsPro
- Retirement Income Workshop
- Sure-Fire Trading Systems (VectorVest, Inc.)
- Trading as a Business Workshop
- VectorVest 7 EOD
- VectorVest 7 RealTime/IntraDay
- VectorVest AutoTester
- VectorVest Educational Services
- VectorVest OnLine
- VectorVest Options Analyzer
- VectorVest ProGraphics v6.0
- VectorVest ProTrader 7
- VectorVest RealTime Derby Tool
- VectorVest Simulator
- VectorVest Variator
- VectorVest Watchdog
