

HOT TOPICS LIST
- MACD
- Fibonacci
- RSI
- Gann
- ADXR
- Stochastics
- Volume
- Triangles
- Futures
- Cycles
- Volatility
- ZIGZAG
- MESA
- Retracement
- Aroon
INDICATORS LIST
LIST OF TOPICS
PRINT THIS ARTICLE
by Donald W. Pendergast, Jr.
Shares of Philip Morris International, Inc. continue onward in a sustained bullish reversal.
Position: N/A
Donald W. Pendergast, Jr.
Freelance financial markets writer and online publisher of the Trendzetterz.com S&P 500 Weekly Forecast service.
PRINT THIS ARTICLE
ACCUM./DIST. CHAIKIN
Philip Morris: Bullish Reversal Continues
04/28/14 12:13:53 PMby Donald W. Pendergast, Jr.
Shares of Philip Morris International, Inc. continue onward in a sustained bullish reversal.
Position: N/A
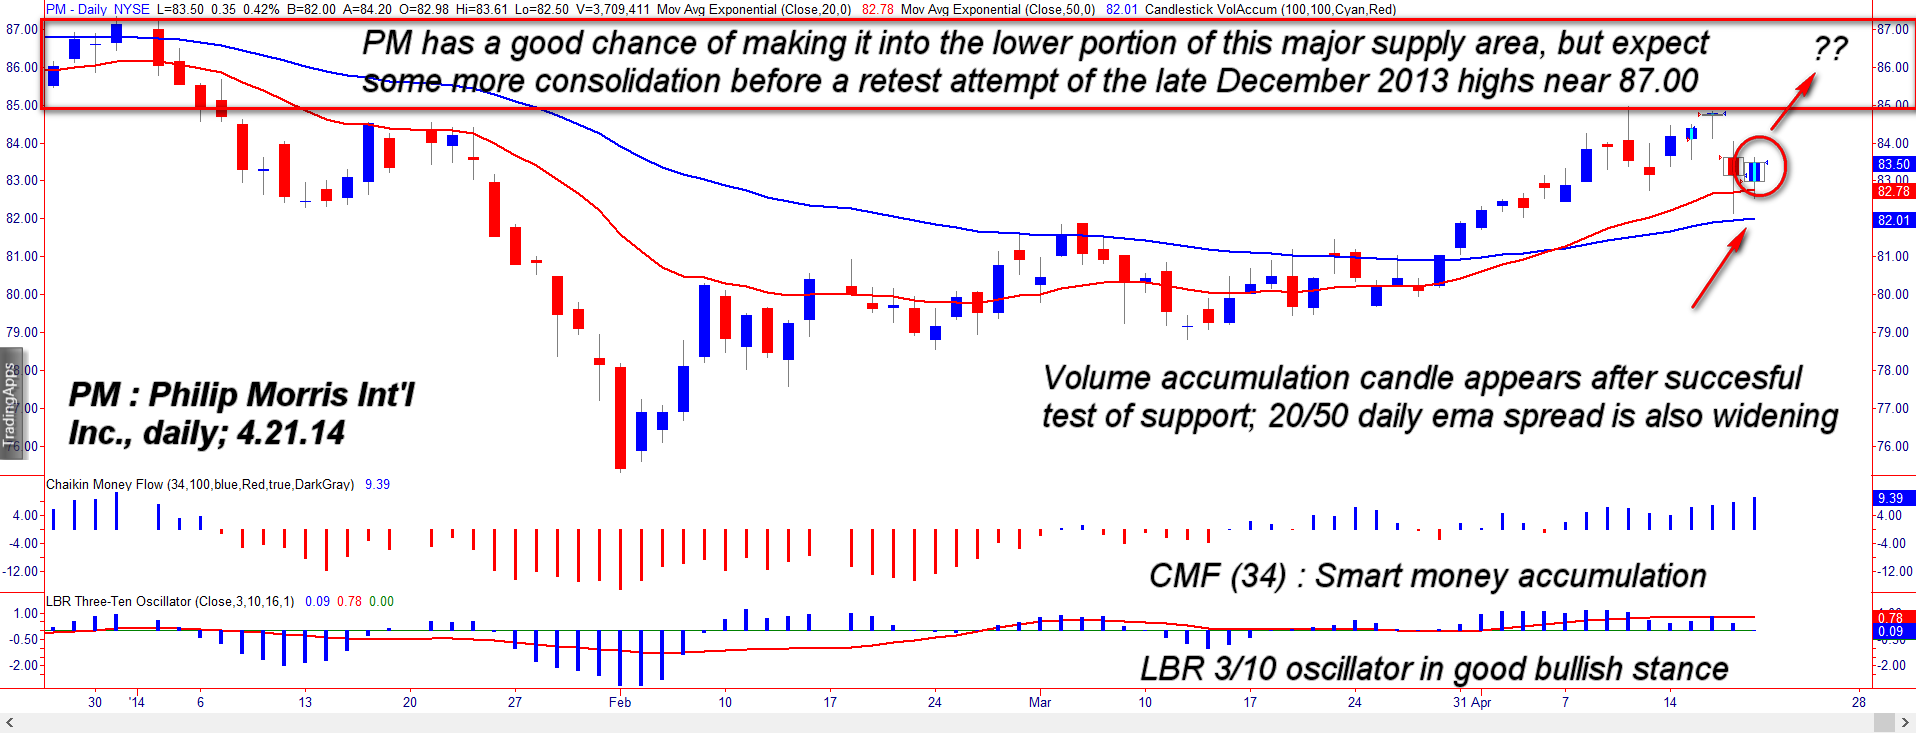
| Large cap S&P 100 index (.OEX) stocks from the consumer staples sector are often less volatile (beta less than 1.00) than their peers in the energy, basic materials and technology sectors, particularly if they offer a substantial dividend yield. However, at times they go into bear market and bull market phases of their own, offering swing and trend traders attractive opportunities for potential profit. Here's a look at a low risk swing buy setup now taking form on the daily chart of Philip Morris (PM), one of the best yielding stocks in the .OEX (Figure 1). |
|
| Figure 1. Philip Morris Int'l, Inc. (PM) appears to be offering swing traders a low risk, high probability long trade setup. |
| Graphic provided by: TradeStation. |
| |
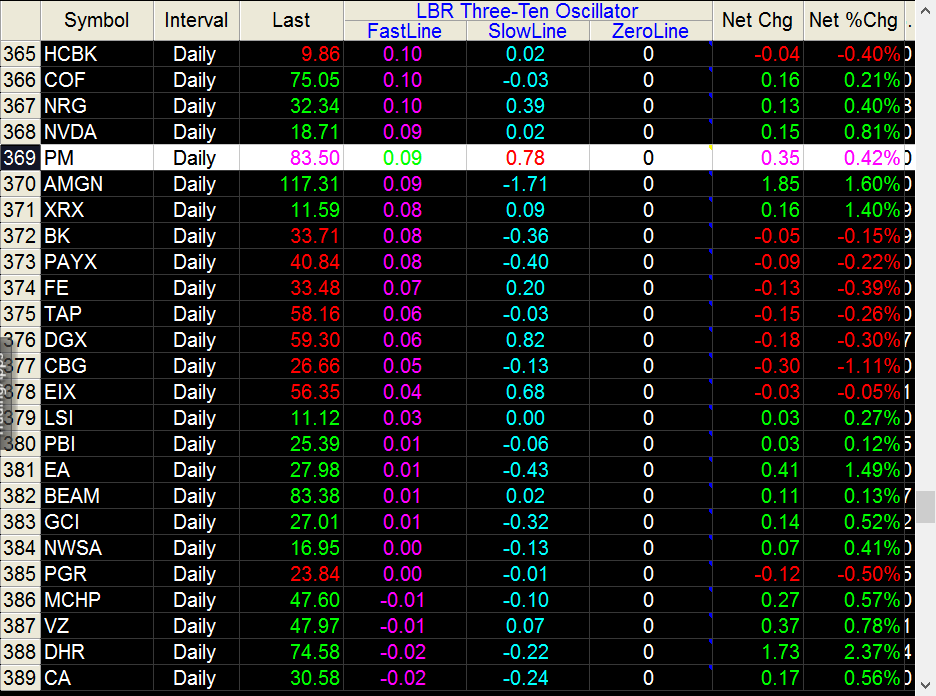
| PM made an intermediate multicyle high in November 2013, hitting 91.81 in the second half of the month; from there, it was all downhill until a major multicycle low formed on February 3, 2014. A great way to confirm the validity of converging multicycle counts after a major decline is to look for the following: 1. A wide range, high volume 'panic' or 'selling climax' candle (if these appear on multiple time frames, so much the better). 2. A touch of or minor penetration of the lower Keltner channel (not shown), one set at about six to eight ATRs away from a 40-period moving average. 3. A subsequent candle reversal setup on the chart you see both 1 and 2 manifesting on. PM fulfilled those basic qualifiers easily at that February 2014 major low and has since gone on to re-establish itself in a sustainable uptrend — a trend marked by steady accumulation by the "smart money" (deep-pockets institutional traders) and three successful tests of key support levels. Even better for the bulls, PM is bouncing higher from 20-bar exponential moving average (EMA) support, complete with a bright aqua blue volume accumulation candle that tells us that the big money players have a lot of faith in PM's ability to garner even more gains in the weeks and months ahead. Remember, it takes months (years?) for a big mutual fund to acquire all of the shares it needs, and they do it slowly, methodically and in a way that ensures they don't buy so much at any one time that they inadvertently run the price up on themselves. And this appears to be what they have been doing for nearly three months now in PM, with the stock reversing and then rallying a little at a time to form new re-accumulation bases. Note the key technicals here, as they also confirm the continued upward momentum that continues to build in the stock: 1. The 34-bar Chaikin Money flow (CMF)(34) histogram continues to strengthen and is well above its zero line. 2. The spread between the 20- and 50-day EMAs continues to widen. 3. The LBR 3/10 oscillator (a variation on the MACD) 'slow line' (red line) is well into bullish territory as is the 'fast line' (blue histogram) and may be viewed as a high probability pullback buy zone (Figure 2). At least some big money traders thought so on April 21, 2014 as they rallied PM after its latest support test. The bottom line here is this — the smart money continues to build a bigger position in PM and smart swing traders can trade along side these 'big boys' by entering long swing trades at low risk buy points, like the one we see now. |
|
| Figure 2. The LBR 3/10 oscillator column in RadarScreen reveals a pullback in the fast line toward zero, even as the slow line remains well above its own zero line. |
| Graphic provided by: TradeStation. |
| Graphic provided by: TradeStation RadarScreen. |
| |
| Playing a long swing in PM is simple enough: 1. Go long a break above 83.61 and immediately set your initial stop just below 82.50. 2. Begin trailing the position with a two to three bar trailing stop of the daily lows once you get a bit of a rally going. 3. If 84.82/84.97 is reached, look to take at least half your open gains, letting the balance run on a trail. If the broad markets are getting nervous again, you might also decide to just take all the profit and run. There is a substantial supply zone (where sellers will likely get aggressive) in between the 85.00 and 87.00 area, so be aware of that if you do decide to hold on for bigger gains on a successful outcome. Keep your account risk at 1 to 2% and remember to trade wisely until we meet here again. |
Freelance financial markets writer and online publisher of the Trendzetterz.com S&P 500 Weekly Forecast service.
| Title: | Market consultant and writer |
| Company: | Trendzetterz |
| Address: | 81 Hickory Hollow Drive |
| Crossville, TN 38555 | |
| Phone # for sales: | 904-303-4814 |
| Website: | trendzetterz.com |
| E-mail address: | support@trendzetterz.com |
Traders' Resource Links | |
| Trendzetterz has not added any product or service information to TRADERS' RESOURCE. | |
Click here for more information about our publications!
PRINT THIS ARTICLE

Request Information From Our Sponsors
- StockCharts.com, Inc.
- Candle Patterns
- Candlestick Charting Explained
- Intermarket Technical Analysis
- John Murphy on Chart Analysis
- John Murphy's Chart Pattern Recognition
- John Murphy's Market Message
- MurphyExplainsMarketAnalysis-Intermarket Analysis
- MurphyExplainsMarketAnalysis-Visual Analysis
- StockCharts.com
- Technical Analysis of the Financial Markets
- The Visual Investor
- VectorVest, Inc.
- Executive Premier Workshop
- One-Day Options Course
- OptionsPro
- Retirement Income Workshop
- Sure-Fire Trading Systems (VectorVest, Inc.)
- Trading as a Business Workshop
- VectorVest 7 EOD
- VectorVest 7 RealTime/IntraDay
- VectorVest AutoTester
- VectorVest Educational Services
- VectorVest OnLine
- VectorVest Options Analyzer
- VectorVest ProGraphics v6.0
- VectorVest ProTrader 7
- VectorVest RealTime Derby Tool
- VectorVest Simulator
- VectorVest Variator
- VectorVest Watchdog