HOT TOPICS LIST
- MACD
- Fibonacci
- RSI
- Gann
- ADXR
- Stochastics
- Volume
- Triangles
- Futures
- Cycles
- Volatility
- ZIGZAG
- MESA
- Retracement
- Aroon
INDICATORS LIST
LIST OF TOPICS
PRINT THIS ARTICLE
by Gary Grosschadl
The networking index and the networkers have been beaten up badly, however it looks primed to at least give us a bear rally.
Position: N/A
Gary Grosschadl
Independent Canadian equities trader and technical analyst based in Peterborough
Ontario, Canada.
PRINT THIS ARTICLE
CHART ANALYSIS
Networking Index Due For A Bounce
10/10/02 08:40:33 AMby Gary Grosschadl
The networking index and the networkers have been beaten up badly, however it looks primed to at least give us a bear rally.
Position: N/A
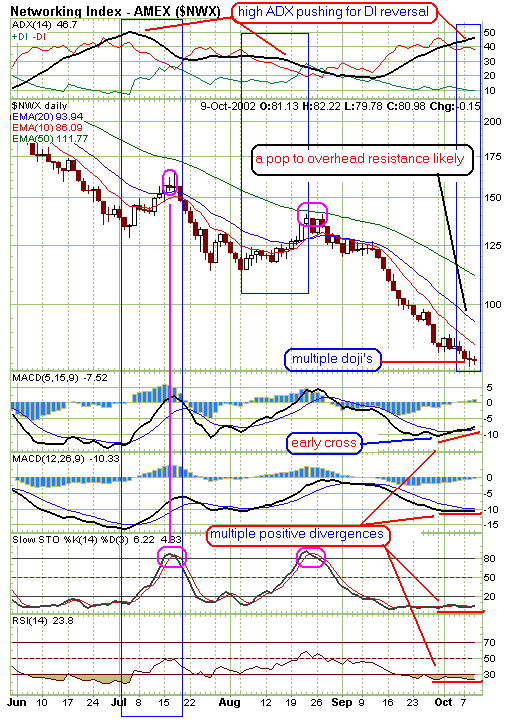
| Candle pattern that show multiple dojis and doji candles (small crosses) after an extended rise or fall often lead to reversals. These candlesticks hint at indecision, or a balance between bulls and bears, that can lead to reversals because the driving force previously in effect (in this case bearish) no longer has a firm hold. A move to the upside from here is the confirmation required for aggressive short-term traders going long. A move below the doji negates the bullish implication. |
| Are there other indicators that corroberate what the candles are hinting at? The trend strength indicator ADX looks compelling as it has "high ADX pushing for DI reversal." When the ADX line rises above both DIs (ideally above 40) and still upslopes, this is a sign that the prevailing trend may change. Looking back at previous similar conditions (highlighted on ADX chart), you can see how this resulted in previous bear rallies. These rallies ended between the 20- and 50-day EMAs, and short-term traders could have played the stochastic turn down from high/overbought levels as circled. |

|
| Graphic provided by: stockcharts.com. |
| |
| This rally, if it comes, can probably be played in a similar fashion using the stochastic downturn. In a much more bullish scenario, if there is a stonger push upwards breaking through the 50-day EMA, then this could be more than a bear rally but we will have to wait for proof. Until then, it is safer to assume another "failure rally" where traders must be wary and nimble to profit. |
| Also note the indicators show multiple positive divergences where the lower low of the index is not confirmed by a lower low on these indicators. This often serves as a profitable heads up in the short term. |
| An important caveat is the direction of the main indices, especially the Nasdaq. If these tank further then the networking index will continue to suffer. |
Independent Canadian equities trader and technical analyst based in Peterborough
Ontario, Canada.
| Website: | www.whatsonsale.ca/financial.html |
| E-mail address: | gwg7@sympatico.ca |
Click here for more information about our publications!
PRINT THIS ARTICLE

Request Information From Our Sponsors
- StockCharts.com, Inc.
- Candle Patterns
- Candlestick Charting Explained
- Intermarket Technical Analysis
- John Murphy on Chart Analysis
- John Murphy's Chart Pattern Recognition
- John Murphy's Market Message
- MurphyExplainsMarketAnalysis-Intermarket Analysis
- MurphyExplainsMarketAnalysis-Visual Analysis
- StockCharts.com
- Technical Analysis of the Financial Markets
- The Visual Investor
- VectorVest, Inc.
- Executive Premier Workshop
- One-Day Options Course
- OptionsPro
- Retirement Income Workshop
- Sure-Fire Trading Systems (VectorVest, Inc.)
- Trading as a Business Workshop
- VectorVest 7 EOD
- VectorVest 7 RealTime/IntraDay
- VectorVest AutoTester
- VectorVest Educational Services
- VectorVest OnLine
- VectorVest Options Analyzer
- VectorVest ProGraphics v6.0
- VectorVest ProTrader 7
- VectorVest RealTime Derby Tool
- VectorVest Simulator
- VectorVest Variator
- VectorVest Watchdog
