HOT TOPICS LIST
- MACD
- Fibonacci
- RSI
- Gann
- ADXR
- Stochastics
- Volume
- Triangles
- Futures
- Cycles
- Volatility
- ZIGZAG
- MESA
- Retracement
- Aroon
INDICATORS LIST
LIST OF TOPICS
PRINT THIS ARTICLE
by Donald W. Pendergast, Jr.
With bullish agreement on two key time frames, June 2014 crude oil futures look set to rally in the near term.
Position: Accumulate
Donald W. Pendergast, Jr.
Freelance financial markets writer and online publisher of the Trendzetterz.com S&P 500 Weekly Forecast service.
PRINT THIS ARTICLE
TREND-CHANNEL
June Crude Oil: Low Risk Swing Buy Zone?
04/24/14 04:51:41 PMby Donald W. Pendergast, Jr.
With bullish agreement on two key time frames, June 2014 crude oil futures look set to rally in the near term.
Position: Accumulate
| "The trend is your friend" is a saying that has helped many traders and investors stay the course in their stock, commodity, bond, and forex positions over the years, and for the most part this market proverb still rings true. Here's a current look at this proven market dynamic at work in the WTI crude oil futures market. |

|
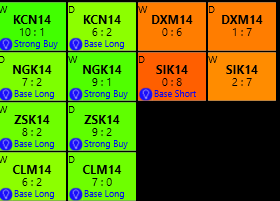
| Figure 1: June 2014 WTI Crude Oil (CLM14). Anytime two adjacent time frames in a market agree on a 'base long' ranking at the same time they feature a bullish trend score, a low risk long trade setup may be forming. |
| Graphic provided by: KnowVera Research, LLC. |
| |
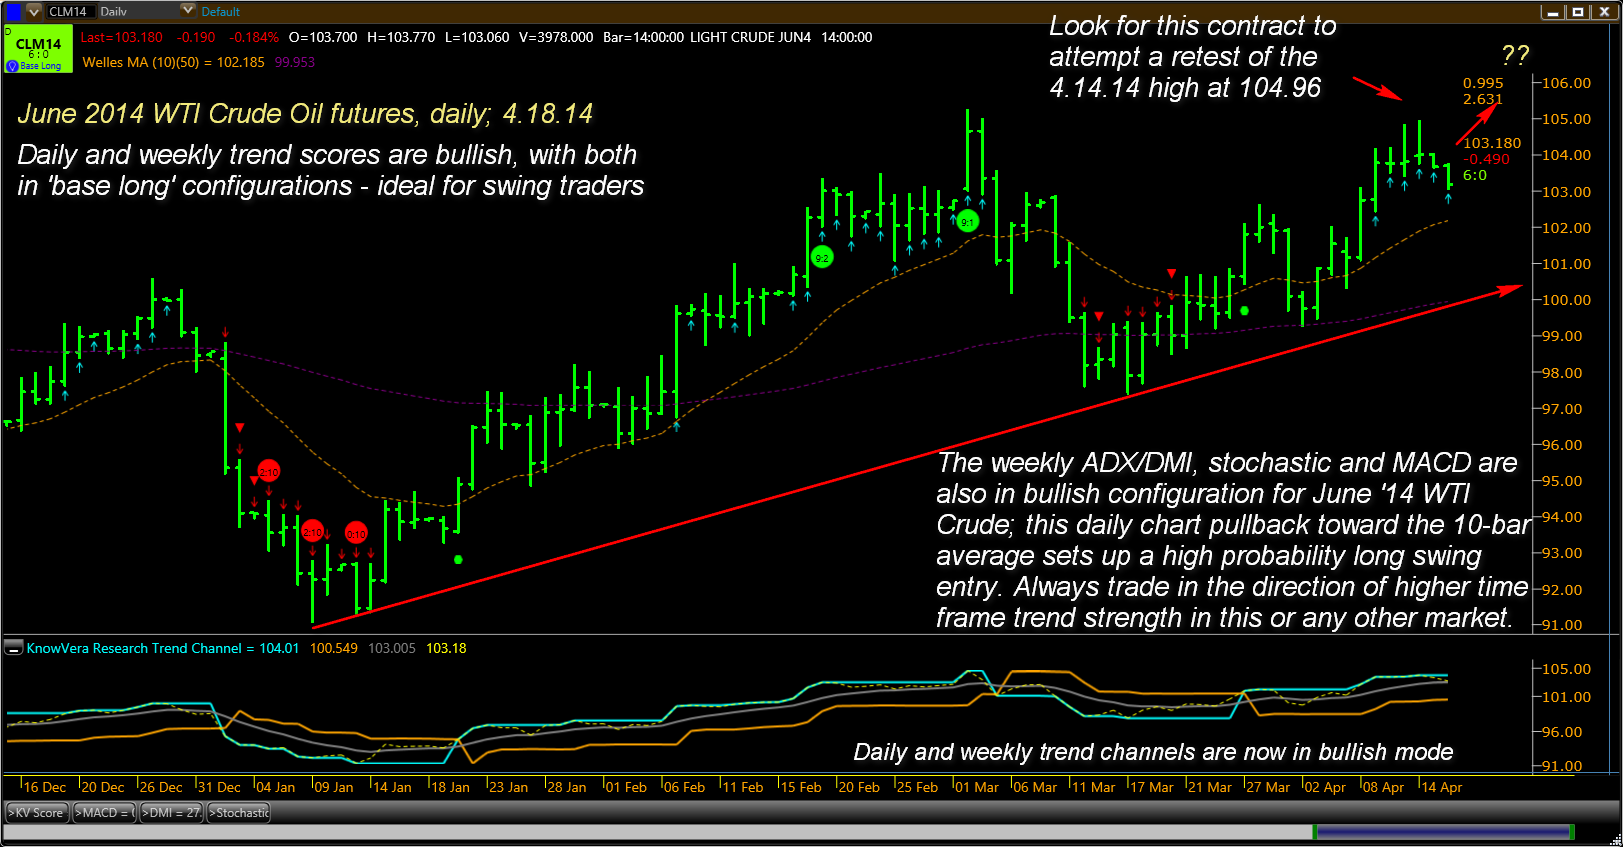
| Scanning through the KnowVera Commodities tab (Figure 1) reveals that June 2014 WTI crude oil futures (CLM14) is in bullish postures on its daily and weekly time frame, as follows: 1. Daily trend score = 6:0 with a 'base long' ranking. 2. Weekly trend score = 6:2, also with a 'base long' ranking. Note the bright green (bullish) colors for the output cells. When two key time frames are both bullish and have base long rankings, well, that is a market worthy of further technical/fundamental evaluation. And CLM14 looks like a potential winner here, especially for swing traders. Seasonal charts for WTI crude oil show a high probability bias of increased prices between February and early June over the past 30 years; this is attributed to the demand generated by refiners who are preparing for the summer driving season in advanced economies (North America and Europe) and is a good predictor that swing and trend traders alike can align their trading activities with. Secondly, there are strong bullish technicals on the daily and weekly charts for CLM14. 1. Weekly chart ADX/DMI are bullish (increasing bullish movement) 2. Weekly stochastic, MACD are strongly bullish. 3. Daily and weekly trend channels are now both in bullish configuration. What sets this up as a low risk, high probability long swing trade is the recent daily chart pullback (Figure 2) toward the rising 10-bar moving average (gold dashed line); this is a classic 'buy the dips' pattern in a market that is shifting into a higher (bullish) gear, so to speak, and offers the bulls the best possible opportunity for near term profits. The added bonus of bullish seasonals makes this a "no brainer" setup for well-capitalized futures traders. |

|
| Figure 2: A classic 'buy the dip' pattern is setting up in CLM14 on its daily time frame. Weekly chart trend and momentum readings are bullish and getting stronger. |
| Graphic provided by: KnowVera Research, LLC. |
| |
| Playing a near term daily swing in CLM14 might go something similar to this: 1. If price declines a bit closer to the 10-bar average, go long with half your intended position size; set an initial stop near 101.50. If price rallies back above the reversal bar high, put on the second half of your position and manage the trade with a two to three bar trailing stop of the daily lows. 2. If/when the prior swing high at 104.85 is hit, take at least half your open profits and continue to trail the rest; there is another profit taking zone near 105.28 and that would be another great place to take more profit off the table and run a closer trail. High probability setups like this one occur on all time frames and in all liquid markets, so learn now to find adjacent time frames (20 minute/60 minute, daily/weekly, weekly/monthly, etc) that are in pullback mode against a strengthening trend (bullish or bearish) and start placing your trades at the low risk entry zones that such setups offer you. Trade wisely until we meet here again. |
Freelance financial markets writer and online publisher of the Trendzetterz.com S&P 500 Weekly Forecast service.
| Title: | Market consultant and writer |
| Company: | Trendzetterz |
| Address: | 81 Hickory Hollow Drive |
| Crossville, TN 38555 | |
| Phone # for sales: | 904-303-4814 |
| Website: | trendzetterz.com |
| E-mail address: | support@trendzetterz.com |
Traders' Resource Links | |
| Trendzetterz has not added any product or service information to TRADERS' RESOURCE. | |
Click here for more information about our publications!
PRINT THIS ARTICLE

Request Information From Our Sponsors
- StockCharts.com, Inc.
- Candle Patterns
- Candlestick Charting Explained
- Intermarket Technical Analysis
- John Murphy on Chart Analysis
- John Murphy's Chart Pattern Recognition
- John Murphy's Market Message
- MurphyExplainsMarketAnalysis-Intermarket Analysis
- MurphyExplainsMarketAnalysis-Visual Analysis
- StockCharts.com
- Technical Analysis of the Financial Markets
- The Visual Investor
- VectorVest, Inc.
- Executive Premier Workshop
- One-Day Options Course
- OptionsPro
- Retirement Income Workshop
- Sure-Fire Trading Systems (VectorVest, Inc.)
- Trading as a Business Workshop
- VectorVest 7 EOD
- VectorVest 7 RealTime/IntraDay
- VectorVest AutoTester
- VectorVest Educational Services
- VectorVest OnLine
- VectorVest Options Analyzer
- VectorVest ProGraphics v6.0
- VectorVest ProTrader 7
- VectorVest RealTime Derby Tool
- VectorVest Simulator
- VectorVest Variator
- VectorVest Watchdog
