HOT TOPICS LIST
- MACD
- Fibonacci
- RSI
- Gann
- ADXR
- Stochastics
- Volume
- Triangles
- Futures
- Cycles
- Volatility
- ZIGZAG
- MESA
- Retracement
- Aroon
INDICATORS LIST
LIST OF TOPICS
PRINT THIS ARTICLE
by Koos van der Merwe
WD-40 Company currently markets its products in 188 countries worldwide and recorded sales of $368.5 million in fiscal year 2013.
Position: Buy
Koos van der Merwe
Has been a technical analyst since 1969, and has worked as a futures and options trader with First Financial Futures in Johannesburg, South Africa.
PRINT THIS ARTICLE
RSI
A Company To Look At
04/24/14 04:39:20 PMby Koos van der Merwe
WD-40 Company currently markets its products in 188 countries worldwide and recorded sales of $368.5 million in fiscal year 2013.
Position: Buy
| If you believe that the economy throughout the world is improving, in spite of what all the nay-sayers are shouting from the rooftops, then WD-40 is a company you should be looking at. |

|
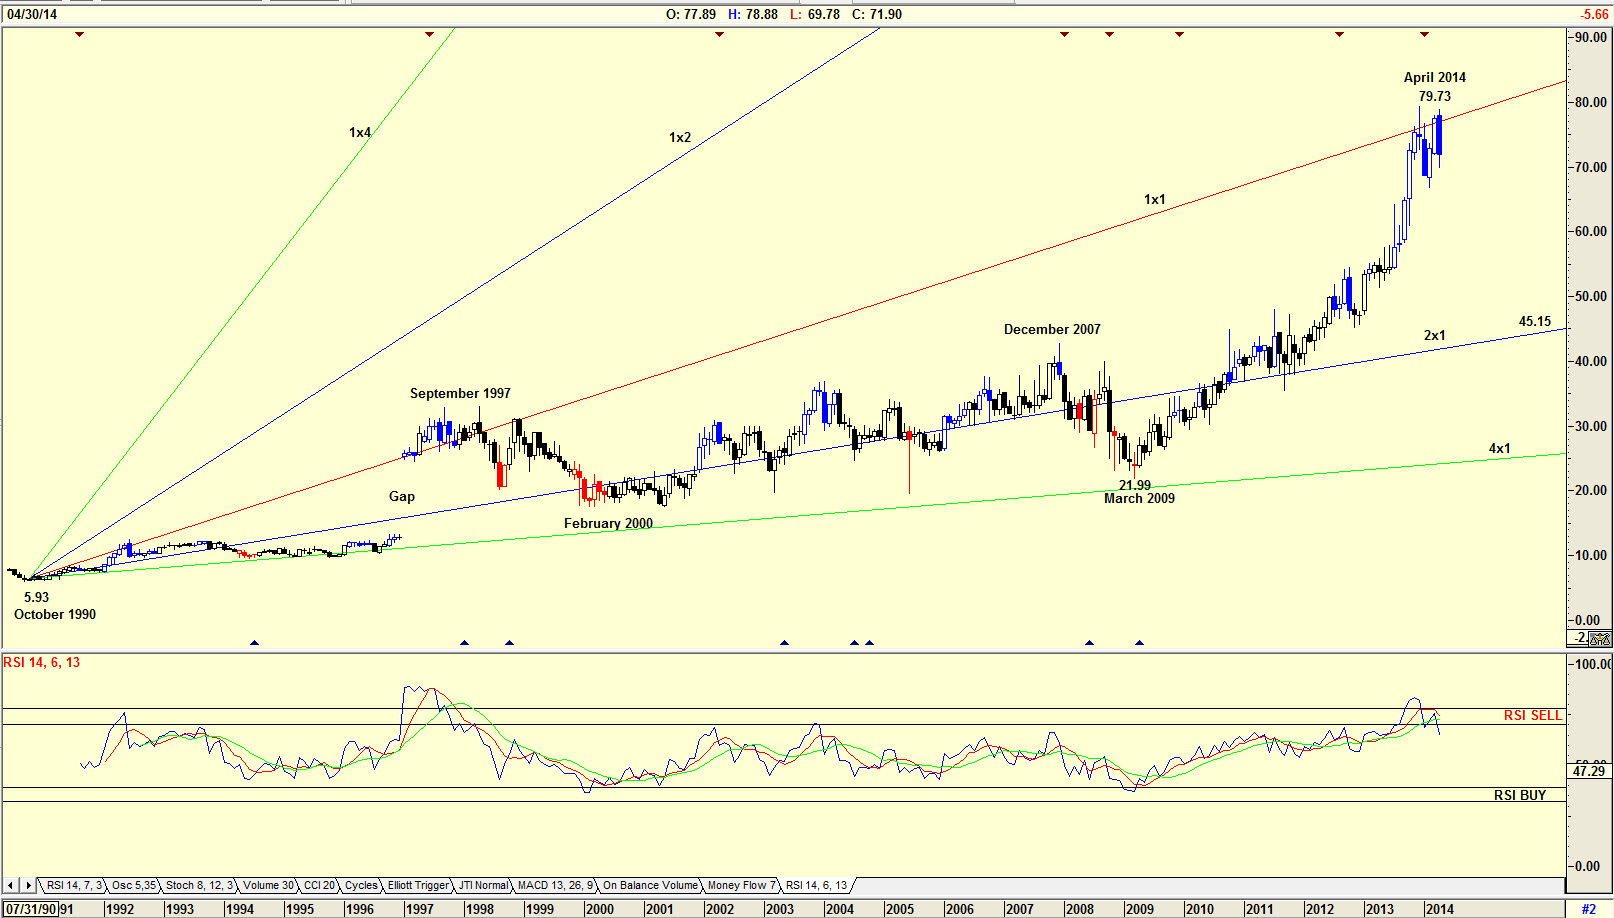
| Figure 1 Monthly chart with Gann angle. |
| Graphic provided by: AdvancedGET. |
| |
| My chart in Figure 1 is a monthly chart showing how the share price rose with a 1x1 Gann angle from October 1990 to its present price of $79.73 in April 2014. Notice how the price rose in September 1997 to test the 1x1 line and then fell to fill the gap. The share price then traced the 2x1 line before falling in December 2007 to test the 4x1 line at $21.99 in March 2009. From that level the share price rose strongly to test the 1x1 line in April 2014 at $79.73. The RSI line is at overbought levels, and has given a sell signal. This suggests that the share price could now fall to the 2x1 line in the region of $45.15. The monthly chart suggests that in the long term, the nay-sayers could be correct. |

|
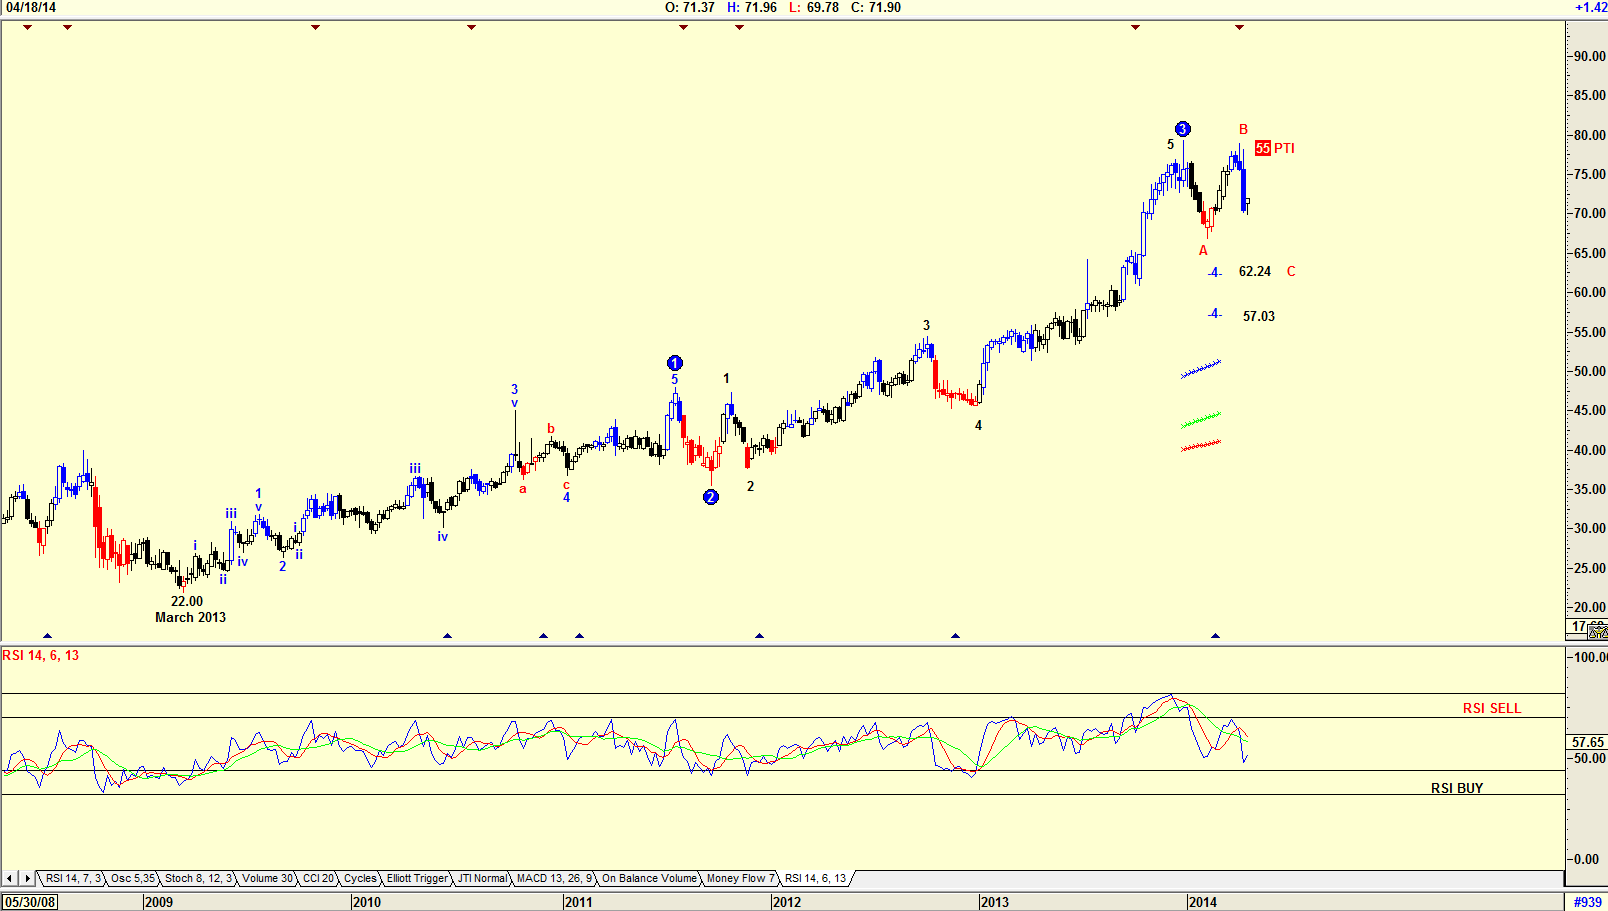
| Figure 2. Weekly chart with Elliott wave count. |
| Graphic provided by: AdvancedGET. |
| |
| The chart in Figure 2 is a weekly chart with an Elliott wave count suggesting that the share price has completed a B-Wave in a WAVE 4 correction, and is now falling in a C-Wave to either the $62.24 or $57.03 levels. The RSI indicator is falling which suggests weakness. The PTI (Probability Index) is 55, which strongly suggests that the price will fall. |

|
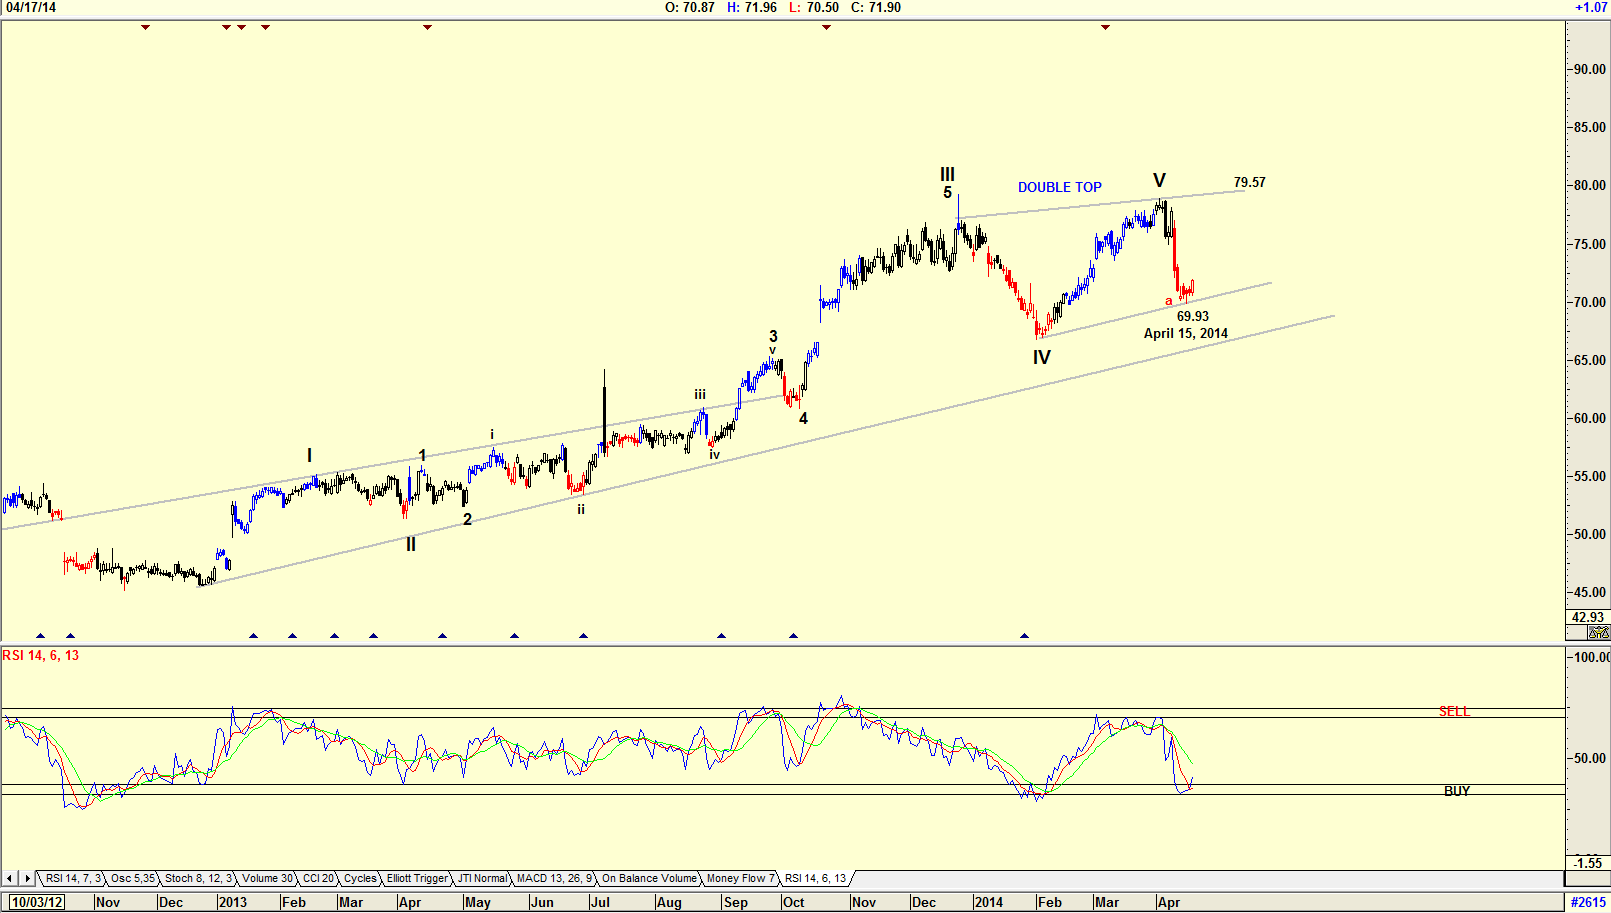
| Figure 3. Daily chart with uncertainty pattern. |
| Graphic provided by: AdvancedGET. |
| |
| The chart in Figure 3 is a daily chart with the RSI indicator suggesting a buy with the price of $79.57, the upper resistance line, as a possible target. The pattern suggests a double top, but with the RSI suggesting a buy, and a target in the region of $79, a short term buy could be a trading benefit. The charts suggest a short-term upward correction that could offer a short-term trade. Using the RSI indicator as a buy/sell signal could offer a short-term trade, but stops should be close. |
Has been a technical analyst since 1969, and has worked as a futures and options trader with First Financial Futures in Johannesburg, South Africa.
| Address: | 3256 West 24th Ave |
| Vancouver, BC | |
| Phone # for sales: | 6042634214 |
| E-mail address: | petroosp@gmail.com |
Click here for more information about our publications!
PRINT THIS ARTICLE

|

Request Information From Our Sponsors
- StockCharts.com, Inc.
- Candle Patterns
- Candlestick Charting Explained
- Intermarket Technical Analysis
- John Murphy on Chart Analysis
- John Murphy's Chart Pattern Recognition
- John Murphy's Market Message
- MurphyExplainsMarketAnalysis-Intermarket Analysis
- MurphyExplainsMarketAnalysis-Visual Analysis
- StockCharts.com
- Technical Analysis of the Financial Markets
- The Visual Investor
- VectorVest, Inc.
- Executive Premier Workshop
- One-Day Options Course
- OptionsPro
- Retirement Income Workshop
- Sure-Fire Trading Systems (VectorVest, Inc.)
- Trading as a Business Workshop
- VectorVest 7 EOD
- VectorVest 7 RealTime/IntraDay
- VectorVest AutoTester
- VectorVest Educational Services
- VectorVest OnLine
- VectorVest Options Analyzer
- VectorVest ProGraphics v6.0
- VectorVest ProTrader 7
- VectorVest RealTime Derby Tool
- VectorVest Simulator
- VectorVest Variator
- VectorVest Watchdog
