

HOT TOPICS LIST
- MACD
- Fibonacci
- RSI
- Gann
- ADXR
- Stochastics
- Volume
- Triangles
- Futures
- Cycles
- Volatility
- ZIGZAG
- MESA
- Retracement
- Aroon
INDICATORS LIST
LIST OF TOPICS
PRINT THIS ARTICLE
by Donald W. Pendergast, Jr.
When a fundamentally sound stock experiences violent daily price action, a closer look is in order.
Position: N/A
Donald W. Pendergast, Jr.
Freelance financial markets writer and online publisher of the Trendzetterz.com S&P 500 Weekly Forecast service.
PRINT THIS ARTICLE
VOLUME
CMG: Market Chipping Away At Recent Gains
04/22/14 02:15:42 PMby Donald W. Pendergast, Jr.
When a fundamentally sound stock experiences violent daily price action, a closer look is in order.
Position: N/A
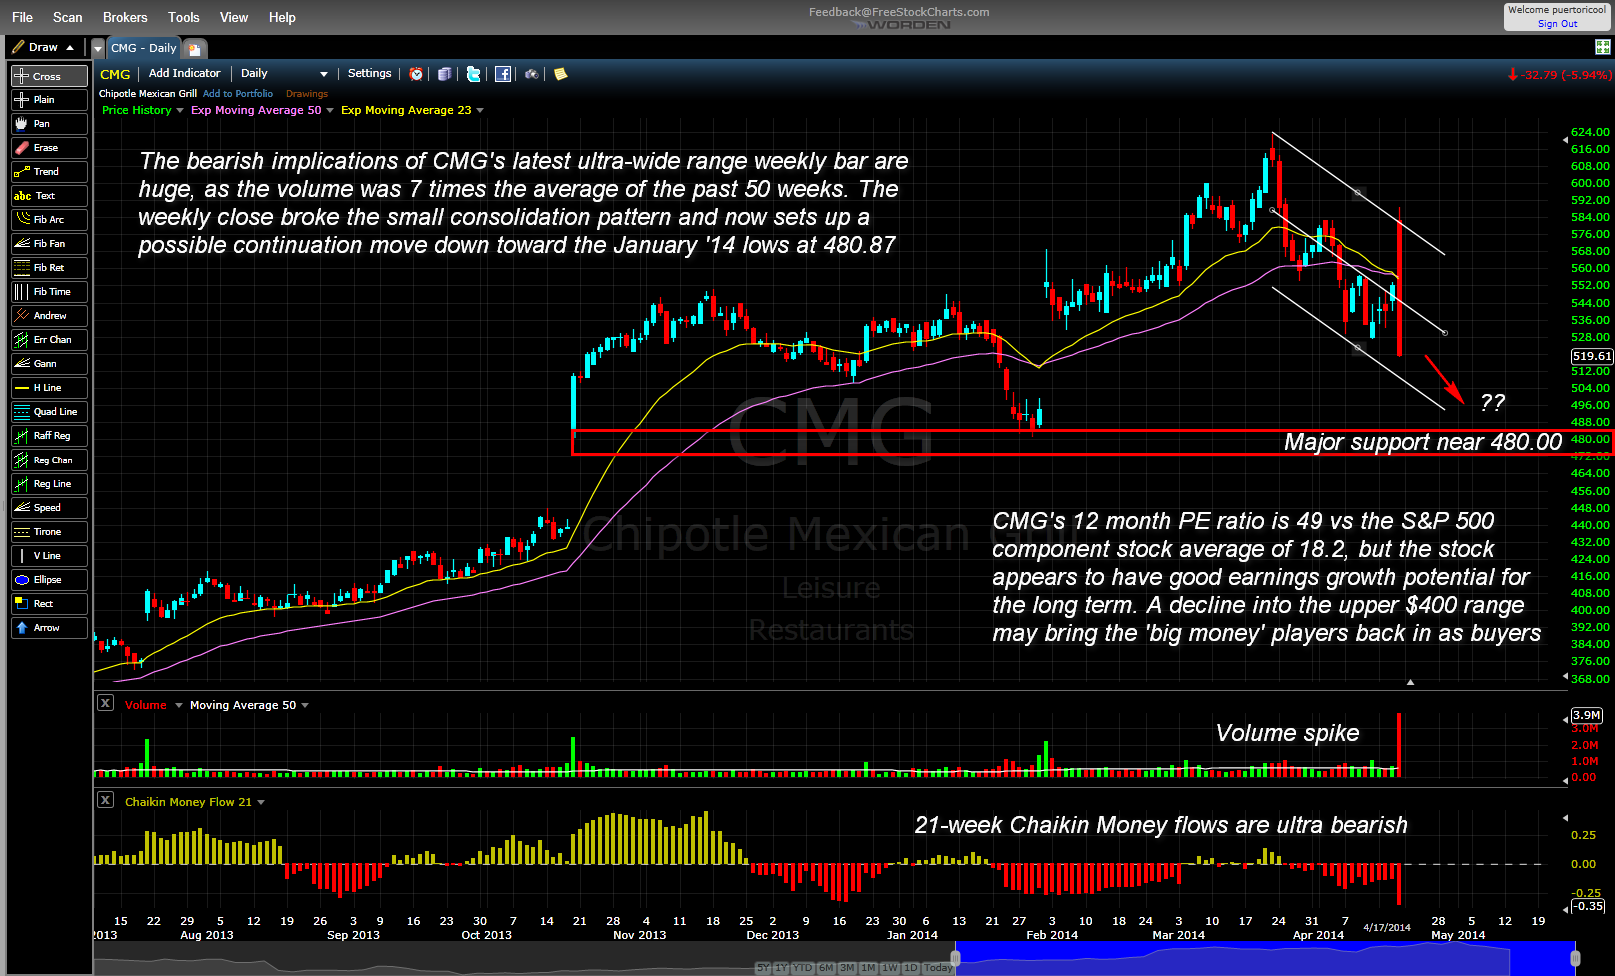
| Between late October 2012 and late March 2014, shares of Chipotle Mexican Grill (CMG) rallied by an astonishing 166% — running from 233.82 to 622.90 in a very persistent uptrend. While long-term fundamentals for the company still appear to be favorable, the recent price action in the stock is anything but assuring to longer term investors, and may offer nimble short sellers some more downside profit opportunity. Here's a closer look. |
|
| Figure 1. Chipotle Mexican Grill (CMG) may be in a bearish continuation move that could see it decline toward major support near 480.00. |
| Graphic provided by: FreeStockCharts.com. |
| |
| Prior to the trading session on April 17, 2014, the recent decline in CMG appeared to be nothing more than a modest, proportional three-wave corrective pattern of its previous uptrend, and when the stock gapped sharply higher at the open it seemed that CMG might be destined for a retest rally of its all-time high of 622.90. Soon after the open, however, the bears took control, trashing the stock for the entire session as they relentlessly sold it off from the intraday high of 588.69 to the session closing price of 519.34. Even more disturbing is that the daily volume on the sell-off spiked to nearly seven times the average volume of the previous 50 trading sessions. All of this carnage happened because CMG's Q1 2014 earnings came in 7% lower than were forecasted by analysts, proving that once again fundamentals really do matter, especially to longer term traders and investors. While no one could really know for certain if the company would miss on its expected earnings, there were already some telltale warning signs in place for traders looking at the following technicals: 1. The 21-week Chaikin Money flow histogram (CMF)(21) had already confirmed a major bearish divergence at the March 2014 highs. 2. CMG's 50-day exponential moving average (EMA) had already begun to slope lower. 3. The daily chart money flow histogram was already well below its zeroline. 4. The so-called "smart money" (big institutional traders) were aggressively distributing their shares to latecomers to the CMG rally in the previous 10 weeks. So, yes there were clues that more downside was coming, but no one knew exactly how an earnings miss/beat would actually play out. Now that the bears are in full control of CMG for the time being, what might be a good way to capitalize on its current downside momentum, seeing that its next true support level is nearly $40 below last Thursday's closing price of 519.61? |
|
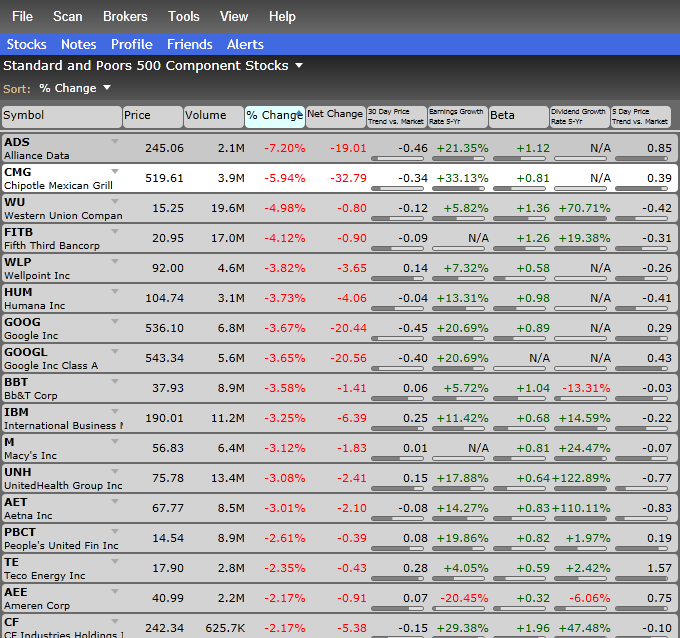
| Figure 2. CMG was one of the worst performers in the S&P 500 index (.SPX) on Thursday April 17, 2014. |
| Graphic provided by: FreeStockCharts.com. |
| |
| The daily chart features a regression channel, one that suggests that the lower channel line may serve as a support area if/when CMG hits it again; a break below 518.52 has a high probability of seeing more selling pressure put to bear (pardon pun) on CMG and could lead to a quick $10 to $15 decline that coincides with a touch of the lower channel. To play this more conservatively, however, look for a minor 30- to 60-minute chart pullback followed by another turn lower to initiate your short sale in CMG. If 518.62 is subsequently taken out, look to add on to your short position and then take profits as the lower channel line on the daily chart is touched. There is potential here for CMG to make it down toward 480.00 (major support), but the channel line looks like a more prudent profit target for most traders. Keep your account risk at 1 to 2% and remember to trade wisely until we meet here again. |
Freelance financial markets writer and online publisher of the Trendzetterz.com S&P 500 Weekly Forecast service.
| Title: | Market consultant and writer |
| Company: | Trendzetterz |
| Address: | 81 Hickory Hollow Drive |
| Crossville, TN 38555 | |
| Phone # for sales: | 904-303-4814 |
| Website: | trendzetterz.com |
| E-mail address: | support@trendzetterz.com |
Traders' Resource Links | |
| Trendzetterz has not added any product or service information to TRADERS' RESOURCE. | |
Click here for more information about our publications!
Comments

Request Information From Our Sponsors
- StockCharts.com, Inc.
- Candle Patterns
- Candlestick Charting Explained
- Intermarket Technical Analysis
- John Murphy on Chart Analysis
- John Murphy's Chart Pattern Recognition
- John Murphy's Market Message
- MurphyExplainsMarketAnalysis-Intermarket Analysis
- MurphyExplainsMarketAnalysis-Visual Analysis
- StockCharts.com
- Technical Analysis of the Financial Markets
- The Visual Investor
- VectorVest, Inc.
- Executive Premier Workshop
- One-Day Options Course
- OptionsPro
- Retirement Income Workshop
- Sure-Fire Trading Systems (VectorVest, Inc.)
- Trading as a Business Workshop
- VectorVest 7 EOD
- VectorVest 7 RealTime/IntraDay
- VectorVest AutoTester
- VectorVest Educational Services
- VectorVest OnLine
- VectorVest Options Analyzer
- VectorVest ProGraphics v6.0
- VectorVest ProTrader 7
- VectorVest RealTime Derby Tool
- VectorVest Simulator
- VectorVest Variator
- VectorVest Watchdog