

HOT TOPICS LIST
- MACD
- Fibonacci
- RSI
- Gann
- ADXR
- Stochastics
- Volume
- Triangles
- Futures
- Cycles
- Volatility
- ZIGZAG
- MESA
- Retracement
- Aroon
INDICATORS LIST
LIST OF TOPICS
PRINT THIS ARTICLE
by Matt Blackman
Love it or hate it, Starbucks has been a star stock performer since it went public more than 20 years ago. But there are growing signs that the stock's future may not be so bright.
Position: N/A
Matt Blackman
Matt Blackman is a full-time technical and financial writer and trader. He produces corporate and financial newsletters, and assists clients in getting published in the mainstream media. He is the host of TradeSystemGuru.com. Matt has earned the Chartered Market Technician (CMT) designation. Find out what stocks and futures Matt is watching on Twitter at www.twitter.com/RatioTrade
PRINT THIS ARTICLE
OPTIONS ANALYSIS
Starbucks: Making The Short Case
04/22/14 02:03:05 PMby Matt Blackman
Love it or hate it, Starbucks has been a star stock performer since it went public more than 20 years ago. But there are growing signs that the stock's future may not be so bright.
Position: N/A
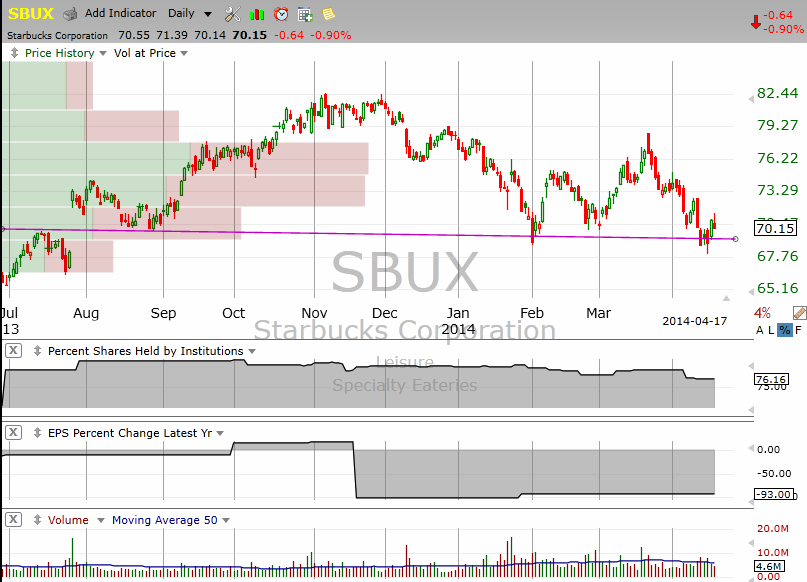
| Since bottoming in March 2009, Starbucks Corp. (SBUX) was trading around $8.20. In November 2013, it hit an all-time high of $82.50, a gain of more than 700% in just five years. But since then, the stock has entered a downtrend and in the process looks to be building a bearish head & shoulders pattern with a downward sloping neckline around $70. |
| But what may be more interesting are the deteriorating fundamentals the stock is exhibiting that may explain why the stock has been falling. As you see in Figure 2, two fundamental factors stand out. First, institutions have been selling the stock since September 2013. Earnings per share (EPS) may be up in the last quarter but have fallen more than 90% on a year-over-year basis. Another big negative from a valuation standpoint is that the P/E ratio hit an uber high of 455 recently according to data from TC2000.com. |
|
| Figure 1 � Daily chart of Starbucks showing the bearish H&S pattern with the recent price hovering just above the neckline. |
| Graphic provided by: TC2000.com. |
| |
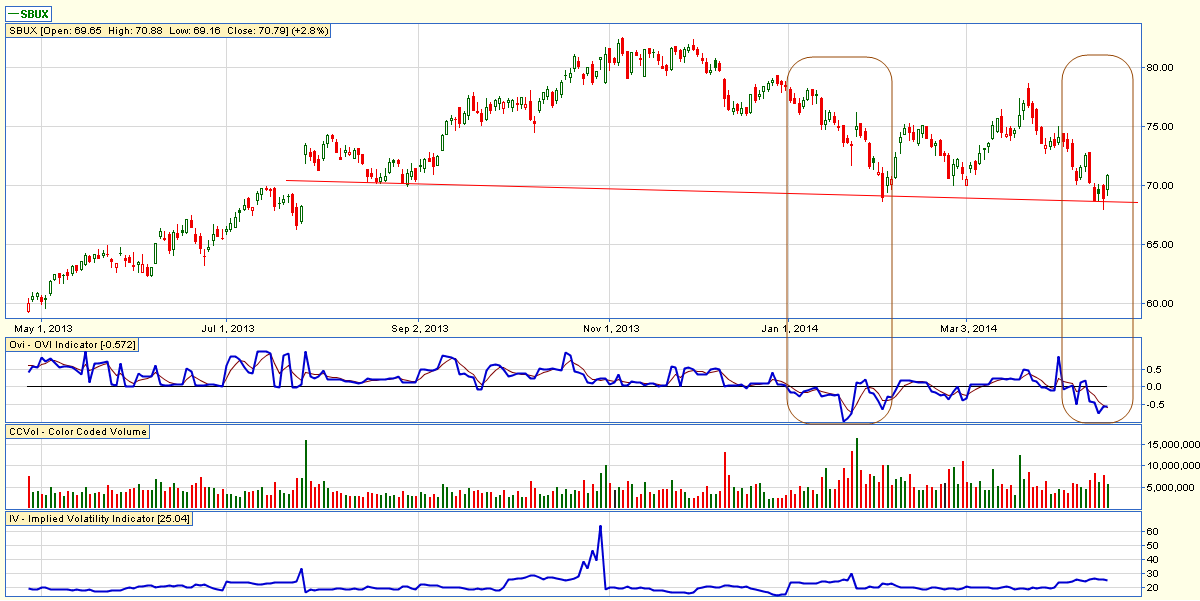
| Assuming SBUX drops below the neckline on above average volume and confirms the H&S pattern, the minimum projected target is $57.27 which would take the stock back to where it was trading a year ago. This pattern is eerily similar to one that was confirmed on Amazon in early April 2014 after showing bearish options activity and an OVI below zero (see ). |
|
| Figure 2 � Daily chart of Starbucks from an options perspective showing the bearish H&S pattern together with the OVI indicator which shows how options traders have been trading. Note that each time the OVI has dropped below zero, the stock has fallen. |
| Graphic provided by: http://www.oviindex.com/. |
| |
| Since January 2014, SBUX has been exhibiting more bearish options activity as evidenced by the OVI indicator below zero. As you can see from Figure 2, the stock has fallen each time the OVI turned negative. |
| From a trade perspective, it would be best to see SBUX confirm the H&S pattern on rising volume before considering a short position. If this does not occur, or the overall market resumes its uptrend, all bear bets are off for now. |
Matt Blackman is a full-time technical and financial writer and trader. He produces corporate and financial newsletters, and assists clients in getting published in the mainstream media. He is the host of TradeSystemGuru.com. Matt has earned the Chartered Market Technician (CMT) designation. Find out what stocks and futures Matt is watching on Twitter at www.twitter.com/RatioTrade
| Company: | TradeSystemGuru.com |
| Address: | Box 2589 |
| Garibaldi Highlands, BC Canada | |
| Phone # for sales: | 604-898-9069 |
| Fax: | 604-898-9069 |
| Website: | www.tradesystemguru.com |
| E-mail address: | indextradermb@gmail.com |
Traders' Resource Links | |
| TradeSystemGuru.com has not added any product or service information to TRADERS' RESOURCE. | |
Click here for more information about our publications!
Comments

Request Information From Our Sponsors
- StockCharts.com, Inc.
- Candle Patterns
- Candlestick Charting Explained
- Intermarket Technical Analysis
- John Murphy on Chart Analysis
- John Murphy's Chart Pattern Recognition
- John Murphy's Market Message
- MurphyExplainsMarketAnalysis-Intermarket Analysis
- MurphyExplainsMarketAnalysis-Visual Analysis
- StockCharts.com
- Technical Analysis of the Financial Markets
- The Visual Investor
- VectorVest, Inc.
- Executive Premier Workshop
- One-Day Options Course
- OptionsPro
- Retirement Income Workshop
- Sure-Fire Trading Systems (VectorVest, Inc.)
- Trading as a Business Workshop
- VectorVest 7 EOD
- VectorVest 7 RealTime/IntraDay
- VectorVest AutoTester
- VectorVest Educational Services
- VectorVest OnLine
- VectorVest Options Analyzer
- VectorVest ProGraphics v6.0
- VectorVest ProTrader 7
- VectorVest RealTime Derby Tool
- VectorVest Simulator
- VectorVest Variator
- VectorVest Watchdog