HOT TOPICS LIST
- MACD
- Fibonacci
- RSI
- Gann
- ADXR
- Stochastics
- Volume
- Triangles
- Futures
- Cycles
- Volatility
- ZIGZAG
- MESA
- Retracement
- Aroon
INDICATORS LIST
LIST OF TOPICS
PRINT THIS ARTICLE
by Koos van der Merwe
Yellen: Europe held back by problems in its banking center.
Position: Hold
Koos van der Merwe
Has been a technical analyst since 1969, and has worked as a futures and options trader with First Financial Futures in Johannesburg, South Africa.
PRINT THIS ARTICLE
ELLIOTT WAVE
Bank Of America
04/21/14 05:26:04 PMby Koos van der Merwe
Yellen: Europe held back by problems in its banking center.
Position: Hold
| That is what Janet Yellen said in her talk at the Economic Club of New York at 12:25pm on April 16, 2014. Many expert fundamental analysts listened to what she said, interpreting her words often in contradiction with each other and the market reacted accordingly, up and down. So, by saying that Europe is being held back by problems in its banking center, is she including England whose banking sector is now managed by Mark Carney, the current Governor of the Bank of England and Chairman of the G20's Financial Stability Board? Mark Carney, when he was Governor of the Bank of Canada kept Canadian banks from following US and European Banks in their drama. By not mentioning US Banks, is she saying that the banking system in the US is on the mend and that you can now safely buy US banks? |

|
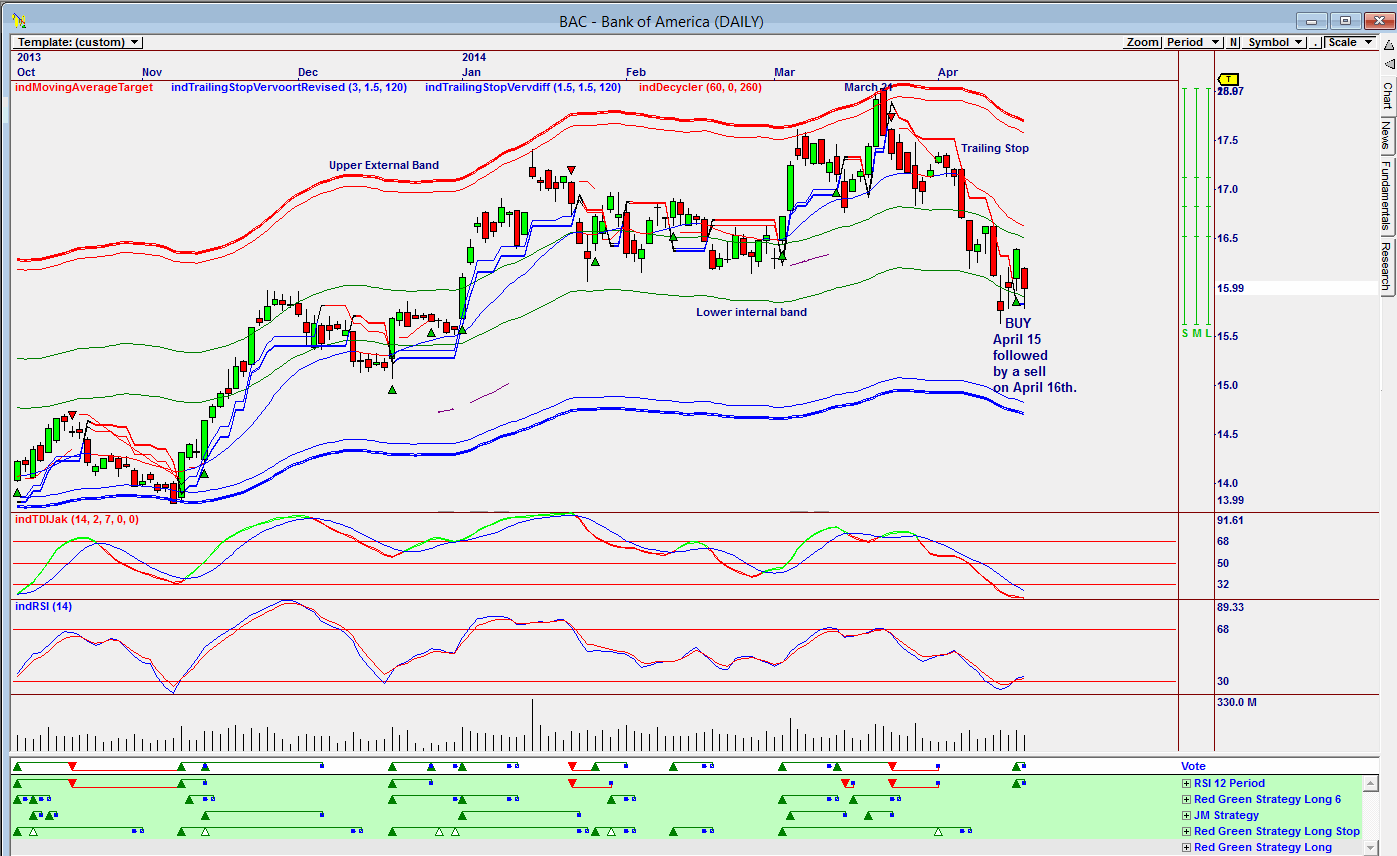
| Figure 1. Omnitrader chart showing buy and sell on Vote line. |
| Graphic provided by: Omnitrader. |
| |
| The chart in Figure 1 is a daily Omnitrader chart of Bank of America (BAC) that shows a buy signal given on April 15, 2014. The vote line gave a buy based on the RSI 12-period strategy shown in green below the vote line. Then, when BAC made the announcement that its litigation expenses increased to $6 billion in the quarter, showing how the bank is still paying for its mortgage missteps nearly six years after the financial crisis, the share price dropped on April 16, 2014 hitting the trailing stop. The chart in Figure 1 shows how the share price fell from the high of $18.03 on March 21, 2014 after hitting the upper external band. The chart also shows the RSI indicator has given a buy signal, and the TDIJak Indicator is close to giving a buy as the price has found support on the lower internal band. |

|
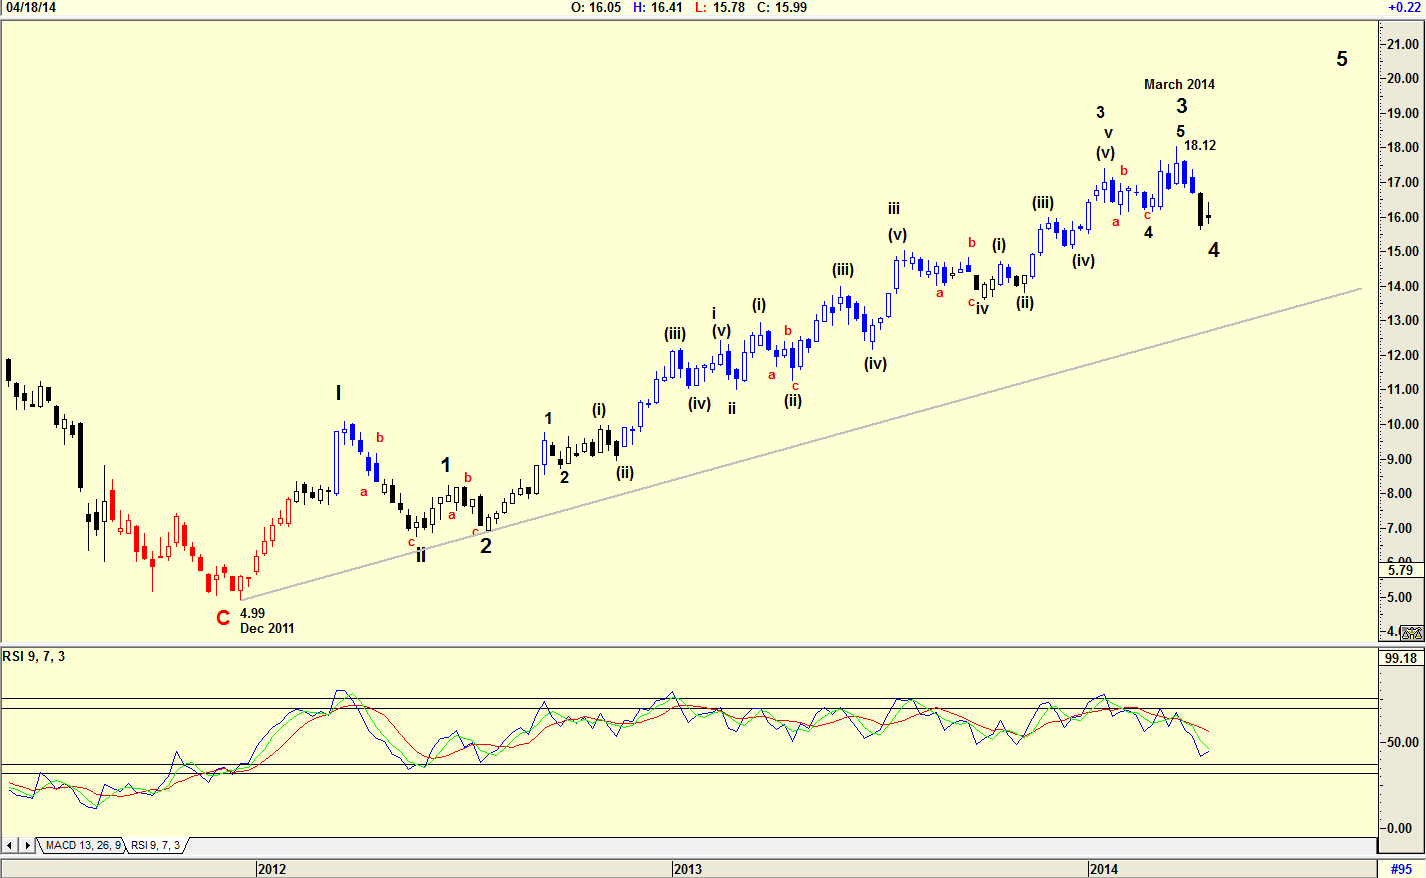
| Figure 2. Weekly chart with Elliott wave count. |
| Graphic provided by: AdvancedGET. |
| |
| The chart in Figure 2 is a weekly chart of BAC showing how the share price rose from a low of $4.99 on December 2011 to a high of $18.12 by March 2014. The Elliott wave count is suggesting that the share price is in a WAVE 4, with possible further downside still there. The RSI indicator is not yet at oversold levels, suggesting further downside is indeed possible. |

|
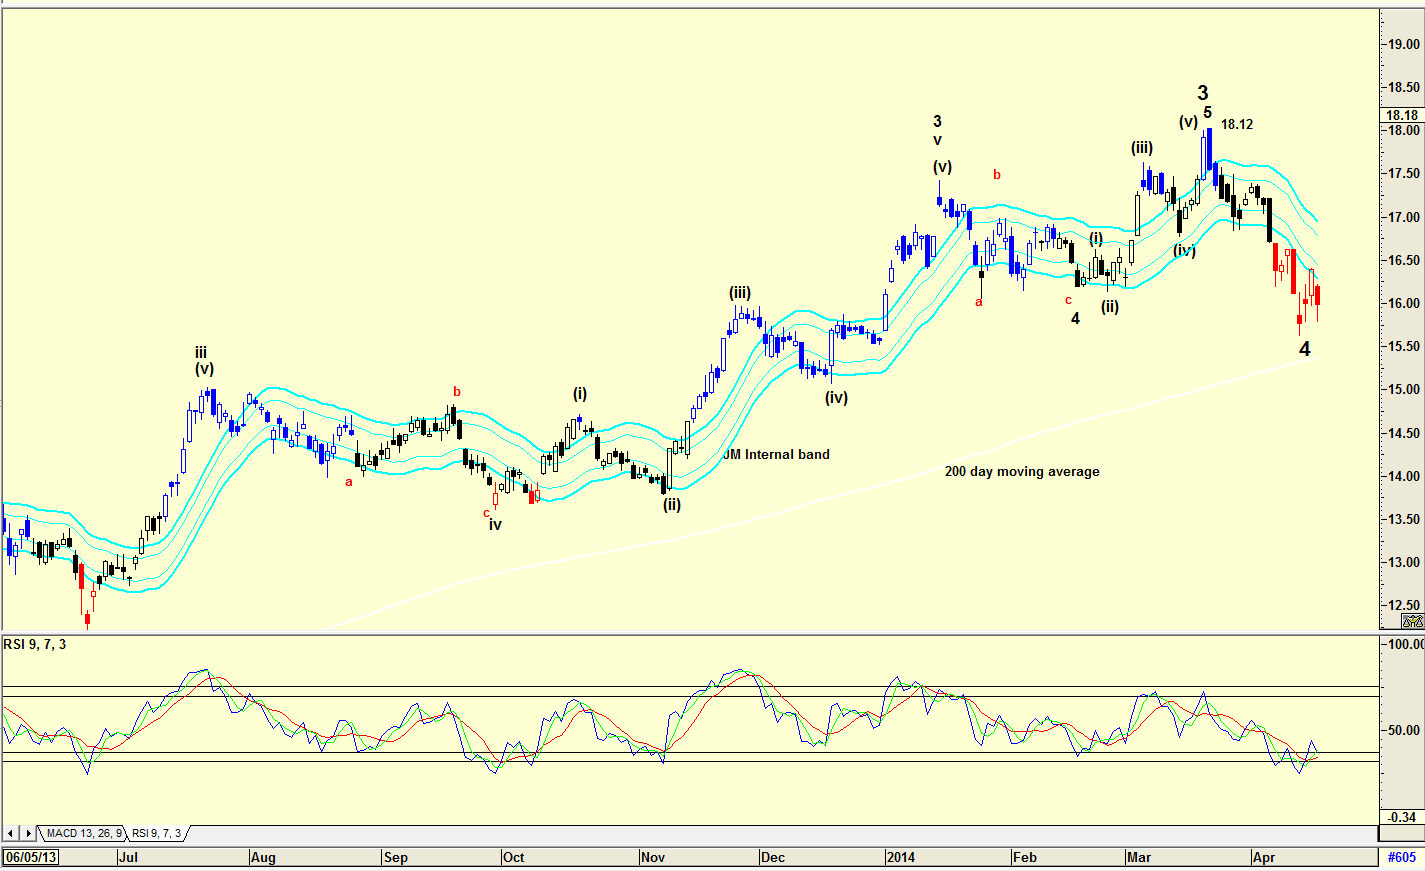
| Figure 3. Daily chart with Elliott wave count and JM Internal Band. |
| Graphic provided by: AdvancedGET. |
| |
| The daily chart in Figure 3 has an Elliott wave count similar to that shown in the weekly chart of Figure 2. The chart is suggesting that Wave 4 could be complete, as suggested by the RSI indicator which has given a buy signal. Conservative investors could wait for the price to move above the upper JM Internal Band indicator. The JM Internal Band is a 15-period simple moving average offset by 2% positive and 2% negative. A move above the upper band signals a buy and below the lower band a short. Yes, I would have been a buyer of BAC on the closing price of April 15, 2014 intending to place my purchase on April 16, but when the company made the announcement on April 16, I would have held back, and not placed my trade. With the technicals suggesting a buy, this is a share on my watch list. Hopefully, their payment for mortgage missteps could be at an end. |
Has been a technical analyst since 1969, and has worked as a futures and options trader with First Financial Futures in Johannesburg, South Africa.
| Address: | 3256 West 24th Ave |
| Vancouver, BC | |
| Phone # for sales: | 6042634214 |
| E-mail address: | petroosp@gmail.com |
Click here for more information about our publications!
PRINT THIS ARTICLE

|

Request Information From Our Sponsors
- VectorVest, Inc.
- Executive Premier Workshop
- One-Day Options Course
- OptionsPro
- Retirement Income Workshop
- Sure-Fire Trading Systems (VectorVest, Inc.)
- Trading as a Business Workshop
- VectorVest 7 EOD
- VectorVest 7 RealTime/IntraDay
- VectorVest AutoTester
- VectorVest Educational Services
- VectorVest OnLine
- VectorVest Options Analyzer
- VectorVest ProGraphics v6.0
- VectorVest ProTrader 7
- VectorVest RealTime Derby Tool
- VectorVest Simulator
- VectorVest Variator
- VectorVest Watchdog
- StockCharts.com, Inc.
- Candle Patterns
- Candlestick Charting Explained
- Intermarket Technical Analysis
- John Murphy on Chart Analysis
- John Murphy's Chart Pattern Recognition
- John Murphy's Market Message
- MurphyExplainsMarketAnalysis-Intermarket Analysis
- MurphyExplainsMarketAnalysis-Visual Analysis
- StockCharts.com
- Technical Analysis of the Financial Markets
- The Visual Investor
