

HOT TOPICS LIST
- MACD
- Fibonacci
- RSI
- Gann
- ADXR
- Stochastics
- Volume
- Triangles
- Futures
- Cycles
- Volatility
- ZIGZAG
- MESA
- Retracement
- Aroon
INDICATORS LIST
LIST OF TOPICS
PRINT THIS ARTICLE
by Donald W. Pendergast, Jr.
Shares of First Solar Inc. made great upward progress in February and early March 2014 but are now close to a major make or break point.
Position: N/A
Donald W. Pendergast, Jr.
Freelance financial markets writer and online publisher of the Trendzetterz.com S&P 500 Weekly Forecast service.
PRINT THIS ARTICLE
RECTANGLES
FSLR: Which Way Now?
04/17/14 05:35:19 PMby Donald W. Pendergast, Jr.
Shares of First Solar Inc. made great upward progress in February and early March 2014 but are now close to a major make or break point.
Position: N/A
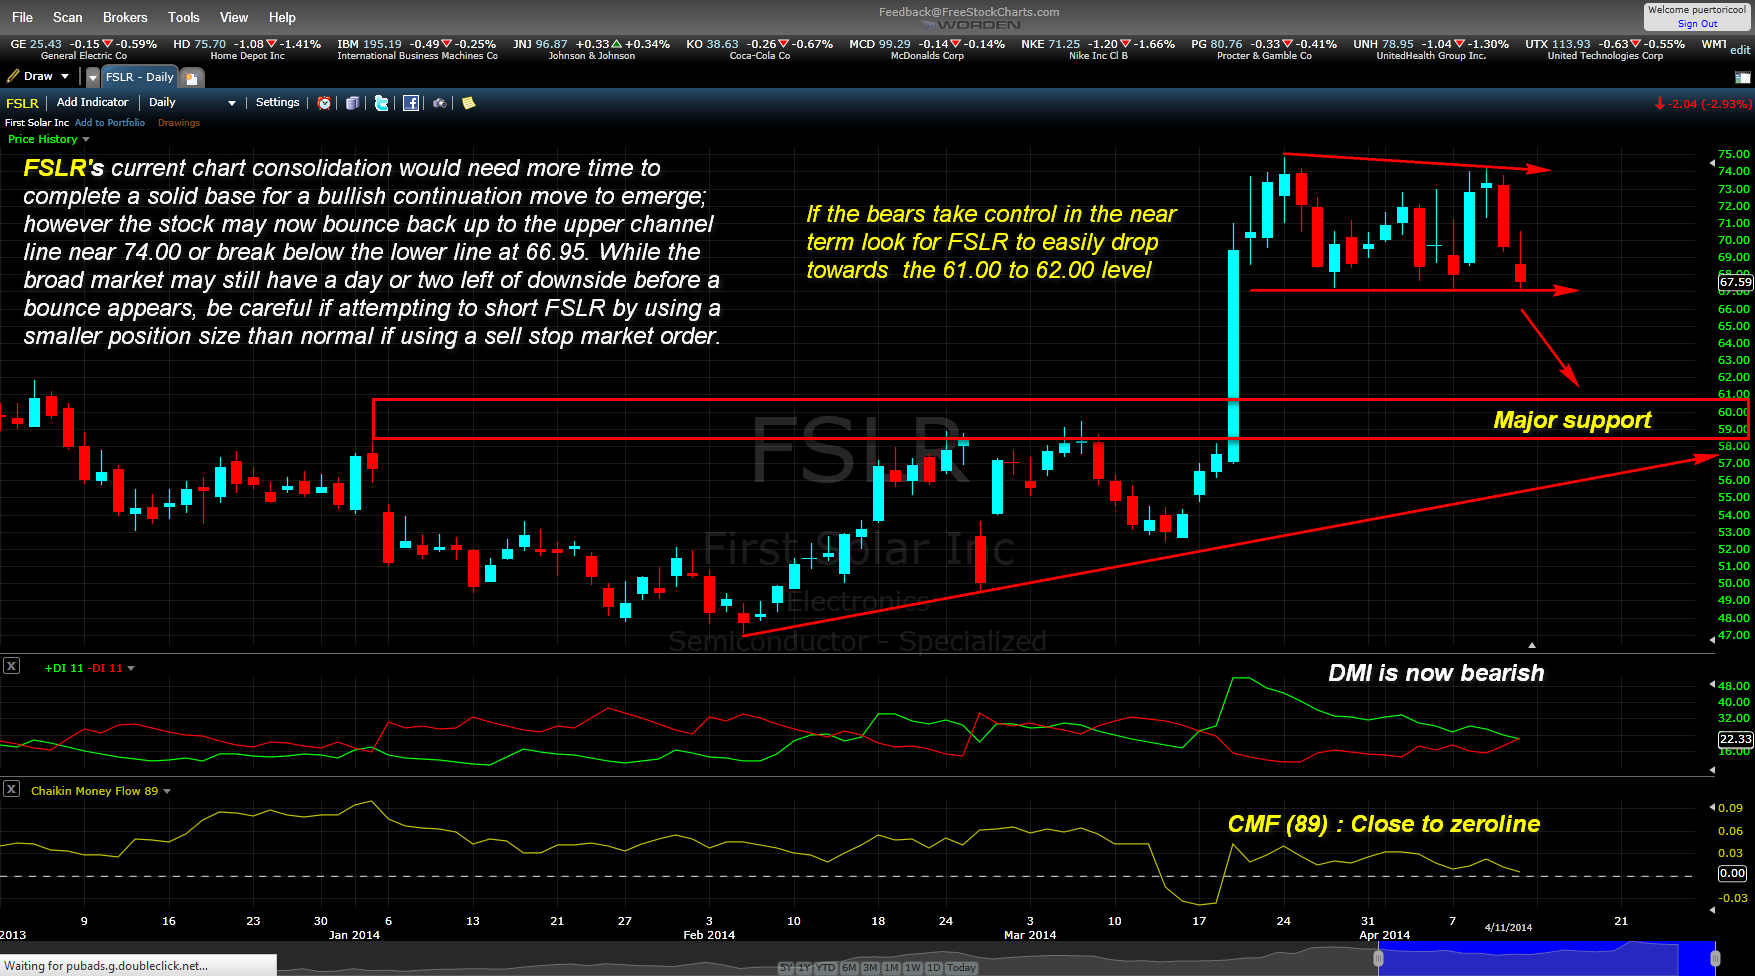
| First Solar (FSLR) shares ran higher by 60% in just six weeks (February 2014-March 2014), and by the time early April rolled around it seemed that for all intents and purposes that the stock might be preparing to stage an immediate continuation of its impressive first quarter rally. But as we hit the second half of April, the stock is still mired in a trading range rectangle, one that is giving mixed signals to traders. Here's a closer look now at FSLR's near-term technical situation. |
|
| Figure 1. First Solar's (FSLR) long-term uptrend line is in no imminent danger of violation at the moment, but unless the major US stock indexes can keep a relief rally going, the probabilities favor a bearish breakdown soon for this stock. |
| Graphic provided by: FreeStockCharts.com. |
| |
| Classical technical analysis pattern recognition fans already know that a stock that stages a sharp, sustained rally and then goes into a sideways, narrow-width trading range in the form of a pennant, wedge or rectangle is a prime candidate to run even higher in a bullish continuation move — and that's pretty much the pattern we see here on FSLR's daily chart (Figure 1). But there are numerous factors at work that suggest caution for the bulls in this liquid solar energy issue: 1. The long term Chaikin money flow (CMF)(89) indicator failed to reach/exceed its January 2014 high as FSLR rocketed higher in February/March 2014. 2. The major US stock indexes have likely already made their highs for the first half of 2014 and may still have another 10-12% of a correction to go before a new sustained bull/relief rally can take hold. 3. The stock has tested the bottom of its range twice already, but only the top of the range once since the consolidation began. 4. The 11-day DMI (Directional Movement Index) has just shifted to the bearish zone. Now, there was a chaotic — but net bullish — short-squeeze rally on April 14, 2014 across the broad US markets, and there could be a few more days of upside potential ahead before things turn ugly once again; wise traders will watch to see if FSLR can meet/exceed the upper channel of its range before considering getting positioned on the long side again, perhaps using a 30- to 60-minute chart to help time a retracement long entry from the upper channel line. But if FSLR doesn't do much rallying and then the Nasdaq 100 (.NDX) and S&P 500 (.SPX) indexes start to tumble again, that could be the start of a great, low risk short trade in FSLR. Always remember that when a chart pattern is nearly "picture perfect" that thousands of other traders will be seeing the same thing (and so will the "smart money" crowd), making it risky to take the initial plunge out of the pattern. Wise traders will wait for a potential pullback after the range breakdown, as that's where the smart money will most likely sell FSLR off hard — after stopping out inexperienced breakout traders, of course. |
|
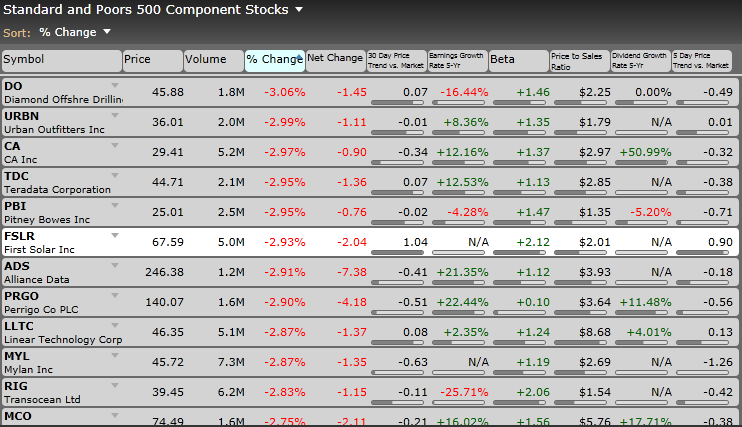
| Figure2. Many stocks in the S&P 500 index (.SPX, SPY) got hit hard recently, including FSLR. |
| Graphic provided by: FreeStockCharts.com. |
| |
| If you can get in on an FSLR short setup as described above, there should be clear sailing all the way down toward the major support zone between 59.00 and 61.00. For a trailing stop, try a five-day simple moving average or even a two to three bar trailing stop of the daily highs. If you get anywhere close to the 61.00 area, start covering your position and make sure you are completely flat by the time 59.00 or 60.00 is hit as that's where the smart money may decide to begin buying again. Use to bottom of the trading range (plus a few ticks) as your initial stop, by the way. Keep your account risk at no more than 1% and remember to always trade wisely until we meet here again. |
Freelance financial markets writer and online publisher of the Trendzetterz.com S&P 500 Weekly Forecast service.
| Title: | Market consultant and writer |
| Company: | Trendzetterz |
| Address: | 81 Hickory Hollow Drive |
| Crossville, TN 38555 | |
| Phone # for sales: | 904-303-4814 |
| Website: | trendzetterz.com |
| E-mail address: | support@trendzetterz.com |
Traders' Resource Links | |
| Trendzetterz has not added any product or service information to TRADERS' RESOURCE. | |
Click here for more information about our publications!
PRINT THIS ARTICLE

Request Information From Our Sponsors
- StockCharts.com, Inc.
- Candle Patterns
- Candlestick Charting Explained
- Intermarket Technical Analysis
- John Murphy on Chart Analysis
- John Murphy's Chart Pattern Recognition
- John Murphy's Market Message
- MurphyExplainsMarketAnalysis-Intermarket Analysis
- MurphyExplainsMarketAnalysis-Visual Analysis
- StockCharts.com
- Technical Analysis of the Financial Markets
- The Visual Investor
- VectorVest, Inc.
- Executive Premier Workshop
- One-Day Options Course
- OptionsPro
- Retirement Income Workshop
- Sure-Fire Trading Systems (VectorVest, Inc.)
- Trading as a Business Workshop
- VectorVest 7 EOD
- VectorVest 7 RealTime/IntraDay
- VectorVest AutoTester
- VectorVest Educational Services
- VectorVest OnLine
- VectorVest Options Analyzer
- VectorVest ProGraphics v6.0
- VectorVest ProTrader 7
- VectorVest RealTime Derby Tool
- VectorVest Simulator
- VectorVest Variator
- VectorVest Watchdog