HOT TOPICS LIST
- MACD
- Fibonacci
- RSI
- Gann
- ADXR
- Stochastics
- Volume
- Triangles
- Futures
- Cycles
- Volatility
- ZIGZAG
- MESA
- Retracement
- Aroon
INDICATORS LIST
LIST OF TOPICS
PRINT THIS ARTICLE
by Koos van der Merwe
With Obamacare becoming a success, the healthcare industry is worth looking at, but company names can be confusing.
Position: Accumulate
Koos van der Merwe
Has been a technical analyst since 1969, and has worked as a futures and options trader with First Financial Futures in Johannesburg, South Africa.
PRINT THIS ARTICLE
TRIANGLES
Omega Healthcare Investors, Inc.
04/15/14 02:39:26 PMby Koos van der Merwe
With Obamacare becoming a success, the healthcare industry is worth looking at, but company names can be confusing.
Position: Accumulate
| Omega Healthcare Investors Inc. (OHI) is not a medical company that manufactures or provides medicines or medical equipment to the healthcare industry. The company is a real estate investment trust (REIT) providing financing and capital to the long-term healthcare industry with a particular focus on nursing facilities in the US. On December 31, 2013, the company held mortgages on 538 nursing facilities and specialty hospitals. The company pays a quarterly dividend with attractive yield, currently at 5.75%. |

|
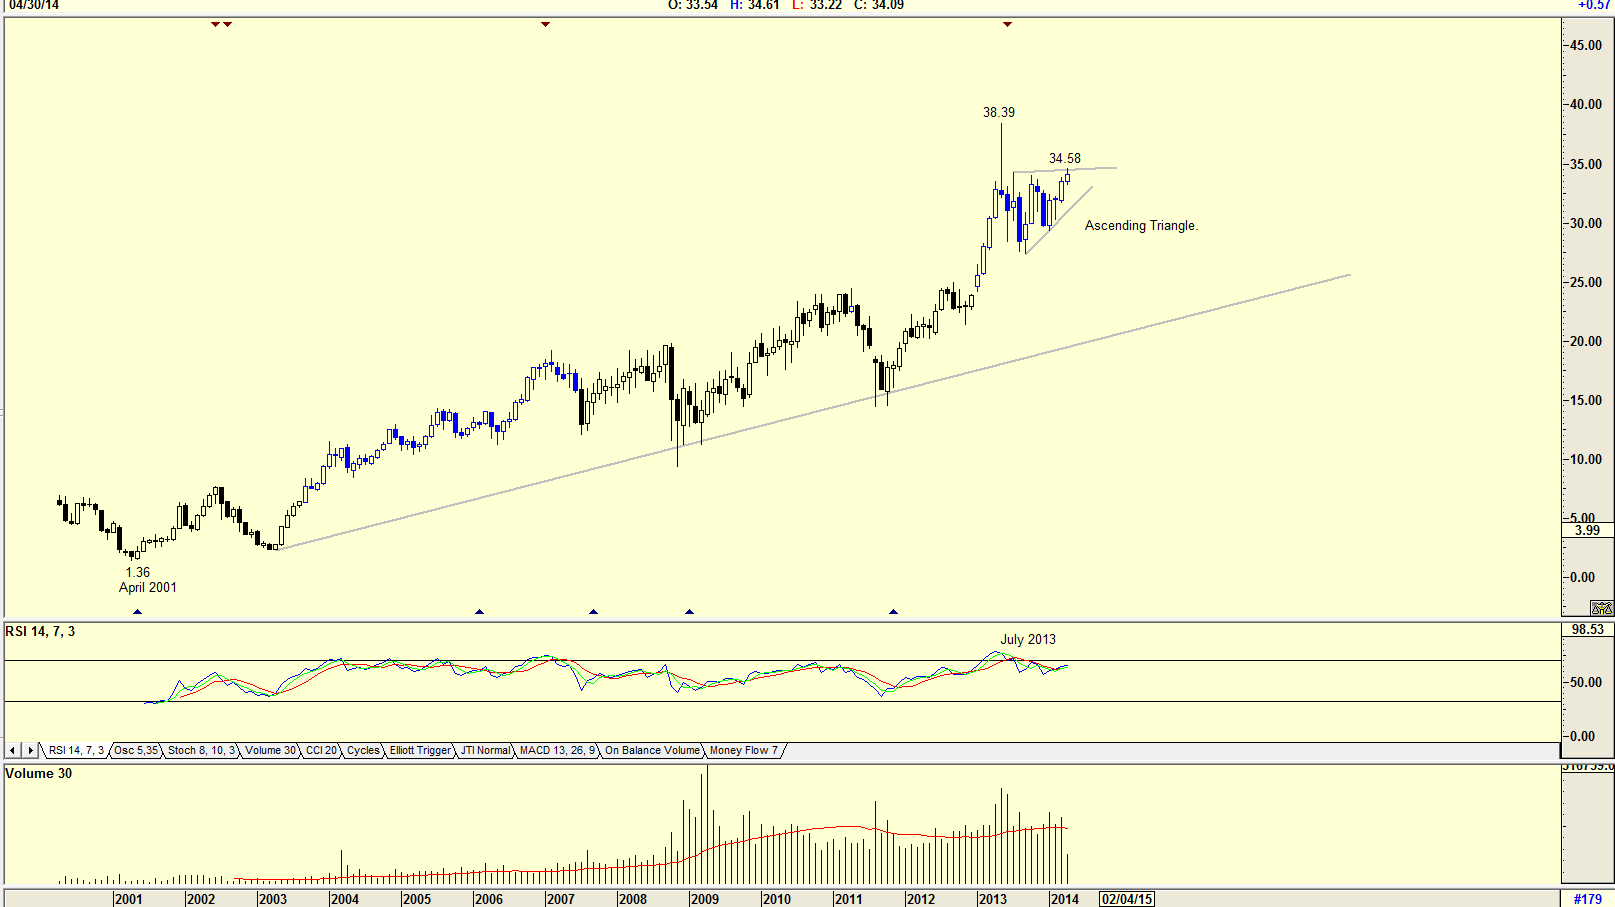
| Figure 1. A monthly chart showing an ascending triangle formation. |
| Graphic provided by: AdvancedGET. |
| |
| The chart in Figure 1 is a monthly chart that shows how the share price has risen from a low of $1.36 in April 2001 to its present high of $34.58. Its yield since 2003 has been consistent, rising as the share price rose. The RSI on the chart is suggesting weakness ahead, having given a sell signal in July 2013 when the share price touched $38.39. However, the share price appears to have formed an ascending triangle. An ascending triangle is characterized by a top-line boundary that is horizontal and a bottom line that is sloping upward. The formation occurs when demand is growing yet continues to meet supply at a fixed price. If demand continues, the supply being distributed at that price will eventually be absorbed by new buyers and prices will then advance rapidly. |

|
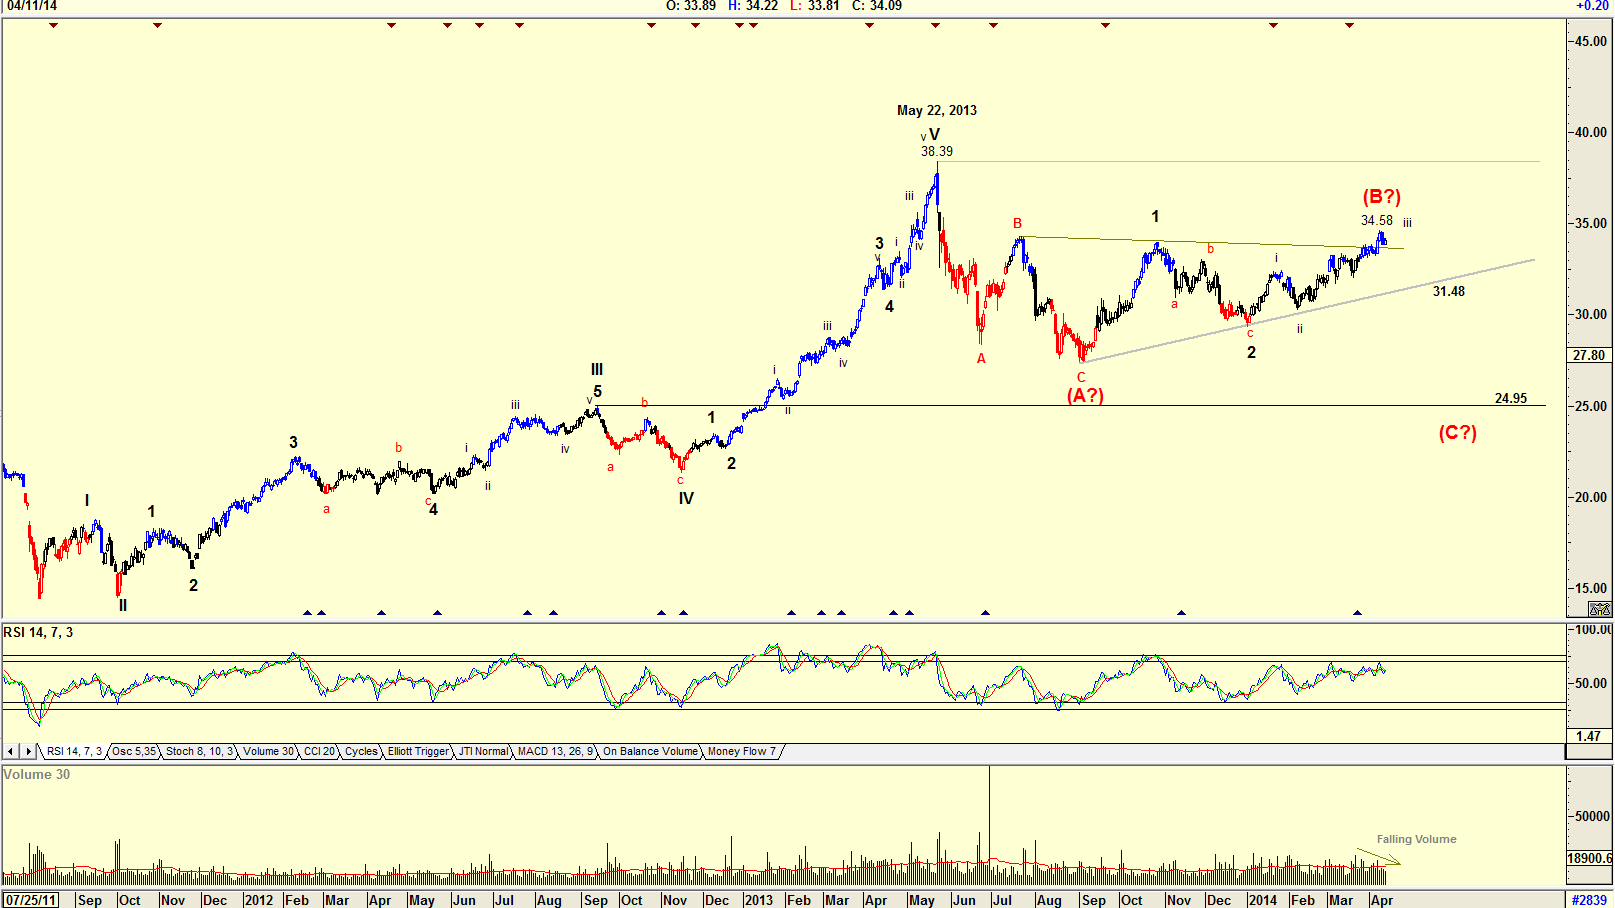
| Figure 2. A daily chart showing alternative Elliott wave counts. |
| Graphic provided by: AdvancedGET. |
| |
| The chart in Figure 2 is a daily chart with an Elliott wave count suggesting that the share price has already moved above the upper top-line boundary of the ascending right-angle triangle. The Elliott wave count of a wave iii of Wave 3 should be correct and wave v of Wave 3 could test the resistance of $38.39. The RSI is not yet at overbought levels suggesting further credibility that the share price should rise. Should this not happen, then the wave count will be an ABC correction with the Wave C falling to the $24.95 level, as shown with the question mark. Volume does appear to be falling as price rose suggesting that this is indeed possible. I would not be a buyer of Omega Healthcare Investors Inc. at the present price, but I would watch the share closely, looking for a correction with the RSI at oversold levels. The consistent yield of 5.75% is attractive and an incentive to buy the share and hold. |
Has been a technical analyst since 1969, and has worked as a futures and options trader with First Financial Futures in Johannesburg, South Africa.
| Address: | 3256 West 24th Ave |
| Vancouver, BC | |
| Phone # for sales: | 6042634214 |
| E-mail address: | petroosp@gmail.com |
Click here for more information about our publications!
Comments

Request Information From Our Sponsors
- StockCharts.com, Inc.
- Candle Patterns
- Candlestick Charting Explained
- Intermarket Technical Analysis
- John Murphy on Chart Analysis
- John Murphy's Chart Pattern Recognition
- John Murphy's Market Message
- MurphyExplainsMarketAnalysis-Intermarket Analysis
- MurphyExplainsMarketAnalysis-Visual Analysis
- StockCharts.com
- Technical Analysis of the Financial Markets
- The Visual Investor
- VectorVest, Inc.
- Executive Premier Workshop
- One-Day Options Course
- OptionsPro
- Retirement Income Workshop
- Sure-Fire Trading Systems (VectorVest, Inc.)
- Trading as a Business Workshop
- VectorVest 7 EOD
- VectorVest 7 RealTime/IntraDay
- VectorVest AutoTester
- VectorVest Educational Services
- VectorVest OnLine
- VectorVest Options Analyzer
- VectorVest ProGraphics v6.0
- VectorVest ProTrader 7
- VectorVest RealTime Derby Tool
- VectorVest Simulator
- VectorVest Variator
- VectorVest Watchdog
