HOT TOPICS LIST
- MACD
- Fibonacci
- RSI
- Gann
- ADXR
- Stochastics
- Volume
- Triangles
- Futures
- Cycles
- Volatility
- ZIGZAG
- MESA
- Retracement
- Aroon
INDICATORS LIST
LIST OF TOPICS
PRINT THIS ARTICLE
by Donald W. Pendergast, Jr.
A stock that can move higher even on days when the broad market tanks is a stock worthy of further investigation.
Position: N/A
Donald W. Pendergast, Jr.
Freelance financial markets writer and online publisher of the Trendzetterz.com S&P 500 Weekly Forecast service.
PRINT THIS ARTICLE
CHART ANALYSIS
PVD: Against The Wind
04/16/14 03:34:15 PMby Donald W. Pendergast, Jr.
A stock that can move higher even on days when the broad market tanks is a stock worthy of further investigation.
Position: N/A
| Shares of Administradora De Fondos ADS (PVD) have risen 12% in the last three weeks, even as the S&P 500 index has gone down by 1.26% and have done well even during last week's heavy downside days in the broad US markets. Here's a look at an easy way to screen for stocks like PVD — those with attractive fundamentals and which may be outperforming even as the S&P 500 and other major market indexes decline. |

|
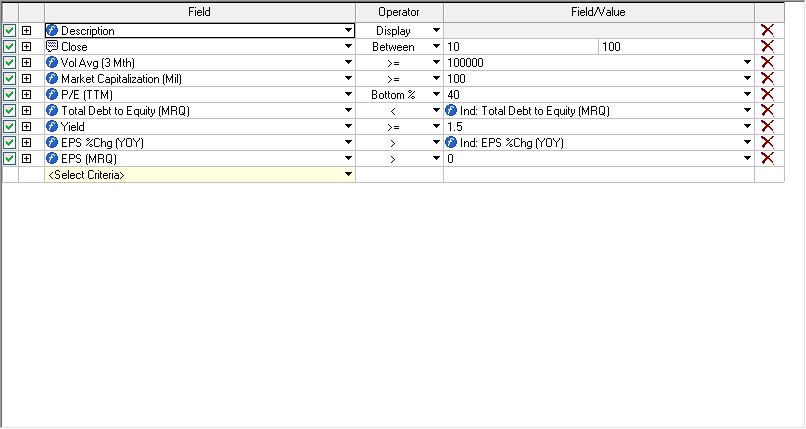
| Figure 1. The Contrarian scanner criteria used to generate the list of stocks where PVD was identified. |
| Graphic provided by: TradeStation. |
| Graphic provided by: TradeStation Scanner. |
| |
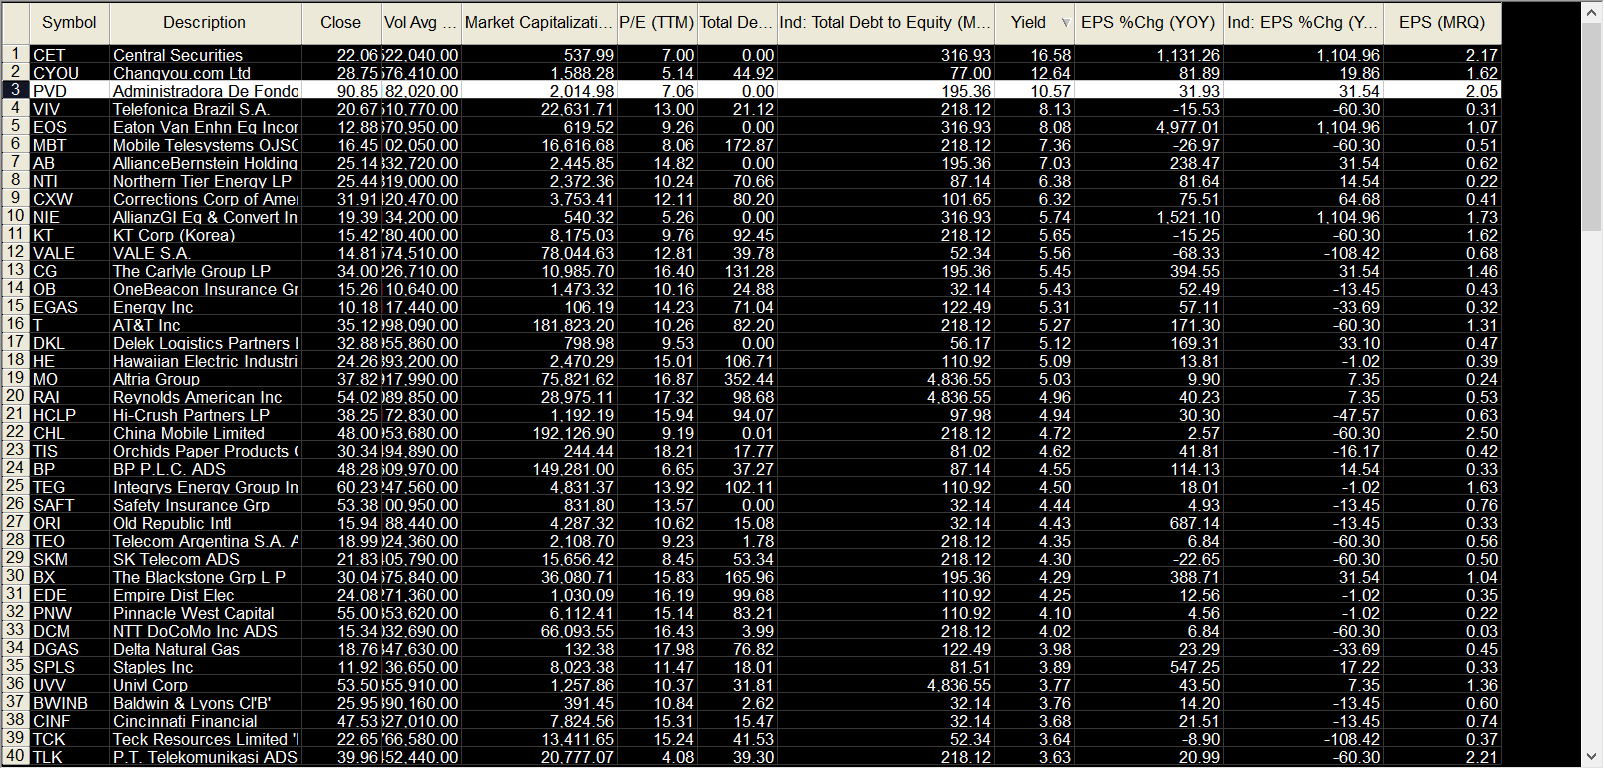
| As the volatility increases in the major US stock indexes — which is not exactly an unexpected phenomenon, especially after an epic five-year long rally — traders and investors begin to look for effective ways to find stocks that may be rising or holding steady. An easy way to find potentially attractive stocks during times of market chaos is to use the "contrarian" stock screener in the scanner section of your program. The screen's description goes like this: "Find stocks with a low P/E and debt/equity but have a solid dividend and expanding EPS." After loading all NASDAQ and NYSE stocks into the screen, I clicked 'run' and the list of trading investing candidates was produced. I double clicked on the 'yield' column header (dividend yield) to bring those stocks with the highest annual yields to the top and then began glancing at the charts of each stock in the list to which, if any, had been rallying even as the .SPX had been declining over the past few weeks. Incredibly, a number of these stocks were increasing in value since the last week of March 2014, and the one with the best combination of chart pattern and gain was that of PVD. Here's what the scan output for PVD reveals to a savvy trader/investor: 1. A zero debt/equity ratio. 2. Year over year change in EPS (earnings per share) increased by nearly 32%. 3. A low P/E (price/earnings) ratio of only 7.06. Fundamentals do matter, particularly if you tend to put on trades that last longer than a few weeks; and never forget that the big mutual funds are always on the hunt for stocks like these that are able to buck a broad market sell-off. Those fundamentals look exceedingly wonderful, but how about the weekly chart for PVD — is it suggesting that the stock may actually be a buy, even as major waves of selling have been unleashed in the broad markets of late? |

|
| Figure 2. The Contrarian scan seeks out stocks with low debt/equity and P/E ratios that also feature solid EPS growth, year over year. |
| Graphic provided by: TradeStation. |
| Graphic provided by: TradeStation Scanner. |
| |
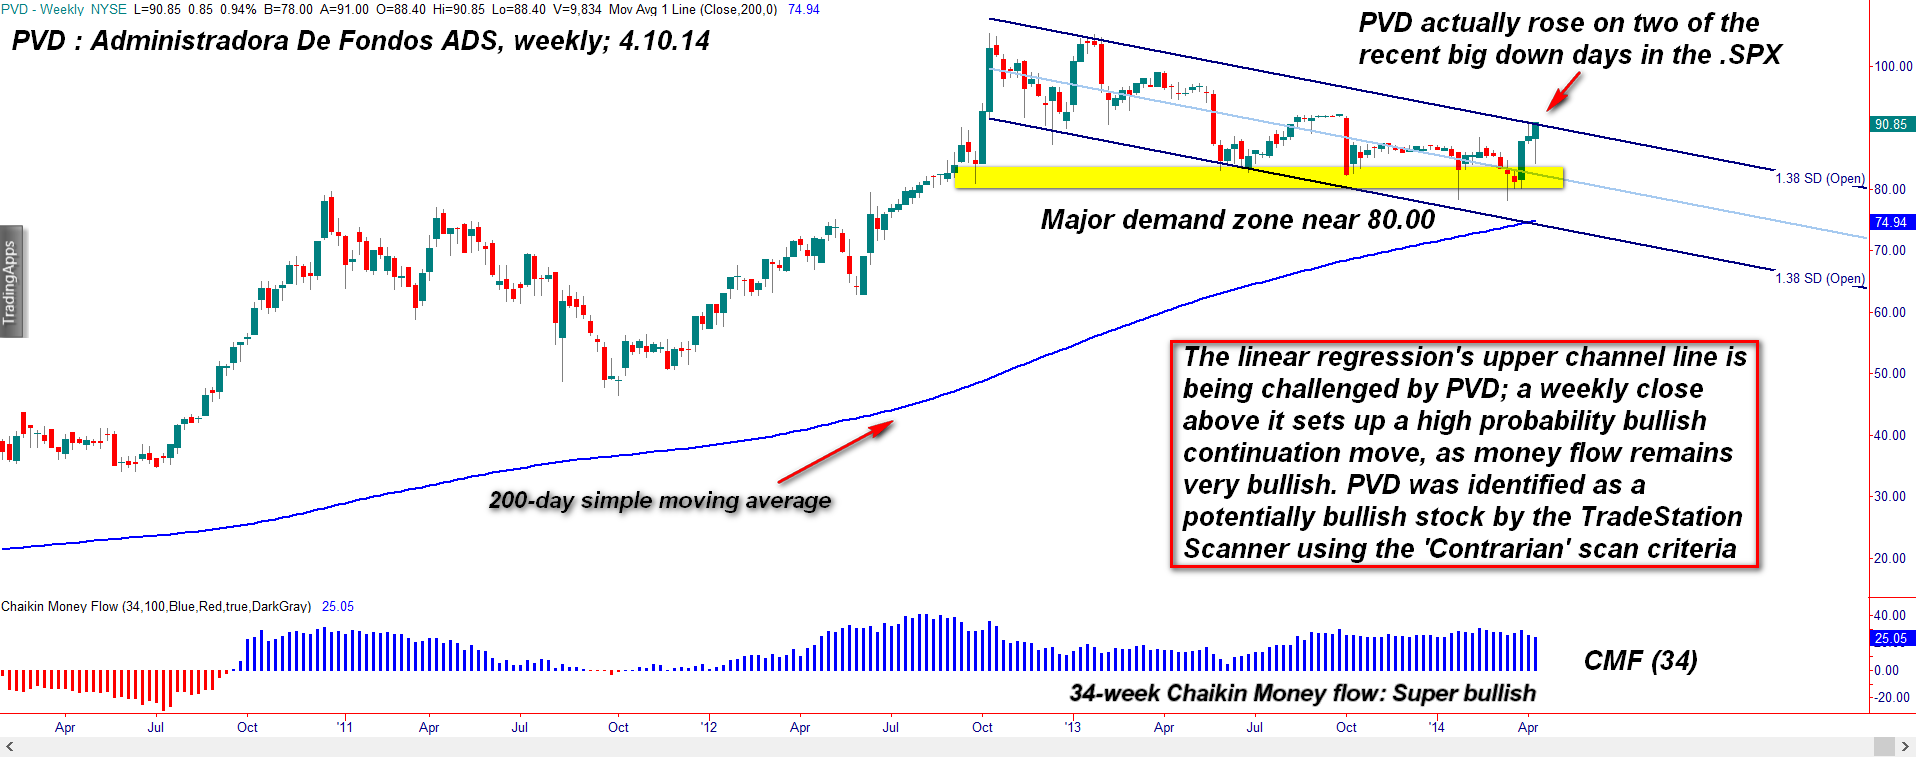
| Amazingly, PVD's weekly chart (Figure 1) reveals a profoundly bullish trade setup for longer term traders/investors: 1. Note the relatively low volatility of the stock's pullback (after a massive four-year rally) since early 2013 — it has mostly been contained within a linear regression channel set to 1.38 standard deviations. 2. There is a major 'demand' zone for this stock in the 80.00 area, which has been successfully tested during the pullback. 3. Long-term money flow remains strongly bullish, even after a year-long retracement that brought PVD close to its 200-week average. 4. PVD's price action over the past three weeks is especially bullish, given all of the previously mentioned fundamental/technical factors in play. If PVD can stage a weekly close above the upper channel line, this looks like a great long trade setup; look for a daily pullback toward the top of the channel line and then use your favorite long timing method for entry to get you in for a high probability swing trade move. There is significant resistance near 99.22 and then at 105.17 for PVD, so be aware of that. Use a trailing volatility stop or even a two- to three-day trailing stop of the daily lows to help you manage such a long trade entry and keep your account risks small at around 1% for this setup. Trade wisely until we meet here again. |

|
| Figure 3. Administradora De Fondos ADS (PVD) has one of the most bullish weekly chart patterns of all the stocks listed in the scan output. |
| Graphic provided by: TradeStation. |
| |
Freelance financial markets writer and online publisher of the Trendzetterz.com S&P 500 Weekly Forecast service.
| Title: | Market consultant and writer |
| Company: | Trendzetterz |
| Address: | 81 Hickory Hollow Drive |
| Crossville, TN 38555 | |
| Phone # for sales: | 904-303-4814 |
| Website: | trendzetterz.com |
| E-mail address: | support@trendzetterz.com |
Traders' Resource Links | |
| Trendzetterz has not added any product or service information to TRADERS' RESOURCE. | |
Click here for more information about our publications!
Comments

|

Request Information From Our Sponsors
- StockCharts.com, Inc.
- Candle Patterns
- Candlestick Charting Explained
- Intermarket Technical Analysis
- John Murphy on Chart Analysis
- John Murphy's Chart Pattern Recognition
- John Murphy's Market Message
- MurphyExplainsMarketAnalysis-Intermarket Analysis
- MurphyExplainsMarketAnalysis-Visual Analysis
- StockCharts.com
- Technical Analysis of the Financial Markets
- The Visual Investor
- VectorVest, Inc.
- Executive Premier Workshop
- One-Day Options Course
- OptionsPro
- Retirement Income Workshop
- Sure-Fire Trading Systems (VectorVest, Inc.)
- Trading as a Business Workshop
- VectorVest 7 EOD
- VectorVest 7 RealTime/IntraDay
- VectorVest AutoTester
- VectorVest Educational Services
- VectorVest OnLine
- VectorVest Options Analyzer
- VectorVest ProGraphics v6.0
- VectorVest ProTrader 7
- VectorVest RealTime Derby Tool
- VectorVest Simulator
- VectorVest Variator
- VectorVest Watchdog
